Stay ahead of the curve
Get exclusive insights delivered directly to your inbox. Join thousands of tech leaders.
TL;DR
- Compare how fast each technology improves: 5% a year is 1.6× after ten years, 50% a year is 58×.
- Convert every metric into one unit, percent better per year. Patent citations give that rate where performance histories are missing.
- Patent volume measures attention: hard drives out-filed solid-state six to one in 2001 while solid-state improved faster.
- Test the method on a past decision your team knows, then sort today's options into fund, monitor, phase out or ignore.
Compare how fast each technology improves. Over a decade the rate dominates: a technology improving 5% a year is 1.6 times better after ten years, and one improving 50% a year is 58 times better. Rank every competing technology on two numbers, its maturity (TRL) and its annual improvement rate, then give each a verdict: fund, monitor, phase out or ignore. Cost today, patent volume and expert preference all describe the present. In the GetFocus storage backtest, hard drives out-filed solid-state storage six to one in 2001, while solid-state improved at 49.6% a year against 29.2% (the full case).
Last updated: 11 November 2026.
Why does today's performance mislead?
Every usual yardstick describes where a technology stands. None says how fast it is moving. Improvement rates also differ enormously: across 1,757 technology domains, MIT researchers measured more than 80% improving at under 25% a year and the fastest at 216% (Singh, Triulzi & Magee, 2021). Because the rates hold steady over long periods (why improvement is predictable), a challenger far behind today overtakes when its rate is higher.
| Yardstick | What it tells you | Where it misleads |
|---|---|---|
| Cost or performance today | Where each technology stands now | Nothing about where it will be in five years |
| Maturity (TRL) | How close each one is to deployment | A mature route can be near the end of its curve |
| Patent volume | Where the attention is | In 2001 hard drives out-filed solid-state 3,316 families to 580 |
| Expert view | Deep experience with the incumbent | Experts know the familiar route best |
| Improvement rate | How fast performance per unit of cost grows | Less reliable where patenting is weak or secret |
How do we compare improvement rates measured on different metrics?
Convert every metric into one unit: percent better per year. Energy density in Wh/kg and cost in €/kWh cannot be set side by side, but their annual rates can. Take the yearly change of each performance-per-cost measure and express it as a compound annual rate.
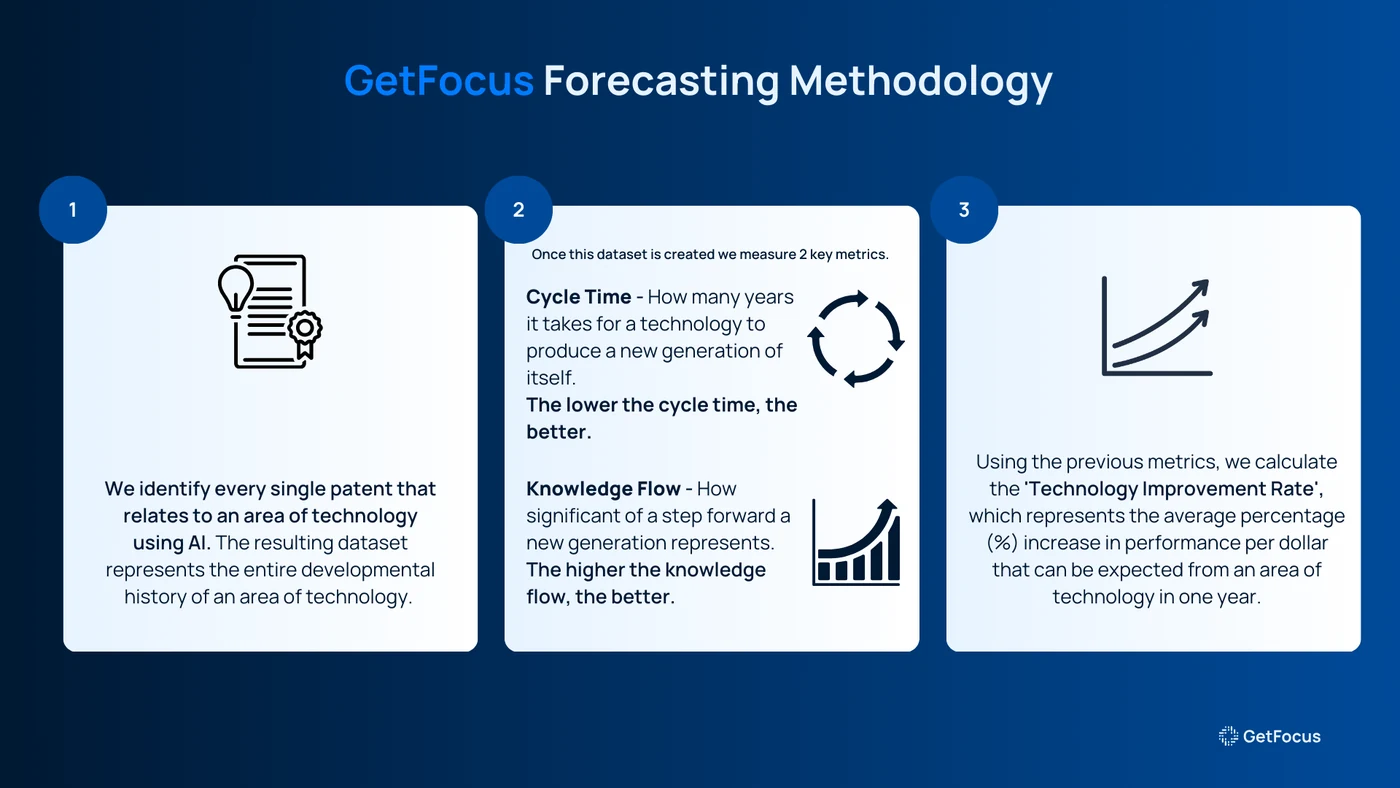
Reliable performance histories rarely exist for emerging routes. Patent citations fill that gap: in MIT research, citation-based measures predicted a domain's improvement rate and the number of patents did not (Benson & Magee, 2015). GetFocus computes this Technology Improvement Rate (TIR) from two signals: cycle time, how quickly new inventions build on recent ones, and knowledge flow, how much later inventions build on them. Every technology gets the same unit, so the comparison is direct. The method pageshows the steps.
What do we do when experts disagree?
Put a number on the table that nobody in the room chose, then test it on a past decision the room already knows the answer to. In the Kodak backtest, the rate separated digital imaging from film from 1980: film improved at 17–26% a year against 29–90% for CCD sensors, two decades before film sales fell off a cliff in 2000. When the method calls a known past correctly, the debate about the present gets shorter.
Christophe Perthuisot, former SVP of R&D at Moët Hennessy and Danone, describes how measuring improvement rates took his teams from a hundred candidate technologies to the four or five worth examining (listen to the episode).
How do we check whether a startup's technology is really ahead?
Separate the company from the route. A demo shows the startup's performance today; the route it belongs to has an improvement rate you can measure. Check which route the startup's patents sit in, then compare that route's rate with the incumbent's.
On the GetFocus battery radar (May 2026), all-solid-state is the most heavily patented route at 9,628 families, and its rate of about 53% a year has not moved since 2022: verdict phase out. Sodium-ion improves at about 125% a year: verdict fund. A startup on the busiest route can still be riding the slower one.
How does this feed a 10-year roadmap?
Score every route that competes for each job on your roadmap, then sort them into four verdicts:
- Fund what is mature and improving fast.
- Monitor what is immature but improving fast.
- Phase out what is mature but improving slowly.
- Ignore what is immature and improving slowly.
Re-check the verdicts every quarter as new patents publish. Our guides on building a 10-year technology roadmapand prioritising R&D projects take it from there, andpresenting R&D strategy to the board covers the last step.
This method fits teams choosing between technologies that compete for the same job in fields where companies patent. It is less reliable where secrecy, tacit know-how or weak patenting hide the progress.
FAQ
What is the Technology Improvement Rate?
The annual rate at which a technology's performance per unit of cost improves, estimated from how its patents cite each other: cycle time and knowledge flow. It is comparative: the gap between two technologies' rates matters more than either number alone.
Can patent counts tell which technology will win?
No. Counts measure attention. In 2001 hard drives logged 3,316 new patent families against 580 for solid-state storage, while solid-state was improving faster, at 49.6% a year against 29.2%.
How far ahead can improvement rates call a winner?
In the GetFocus backtests, years ahead: the rate separated digital imaging from film from 1980, two decades before film sales collapsed in 2000, and flagged flash storage 14 years before Western Digital agreed to buy SanDisk for about $19 billion.
How long does a comparison take?
For one decision, 48 hours. A free Decision Brief maps the competing routes by maturity and improvement rate.
Ready to de-risk your technology bets?
Bring us one technology decision you are weighing. Within 48 hours, a free Decision Brief maps the competing routes by improvement rate, so you know which options deserve the next round of work.