Stay ahead of the curve
Get exclusive insights delivered directly to your inbox. Join thousands of tech leaders.
TL;DR
- Decide in three steps: list every technology competing for each job you need done in 2036, rank each on improvement rate and maturity, then give each a verdict: fund, monitor, phase out or ignore.
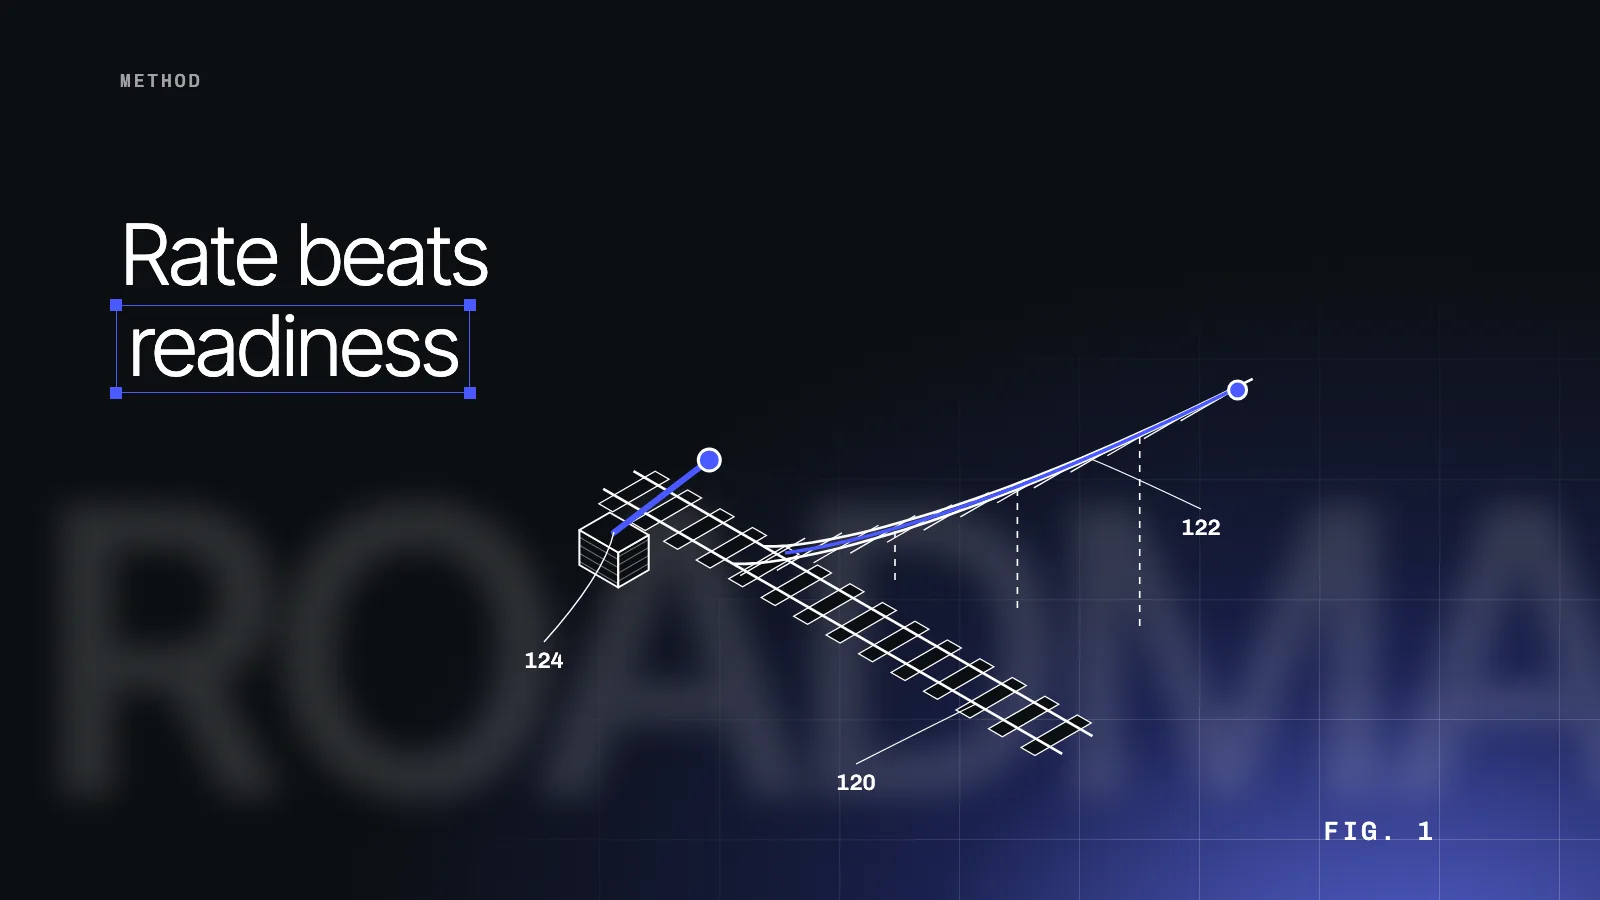
- Over a decade the rate dominates. A technology improving 5% a year is 1.6 times better after ten years. One improving 50% a year is 58 times better.
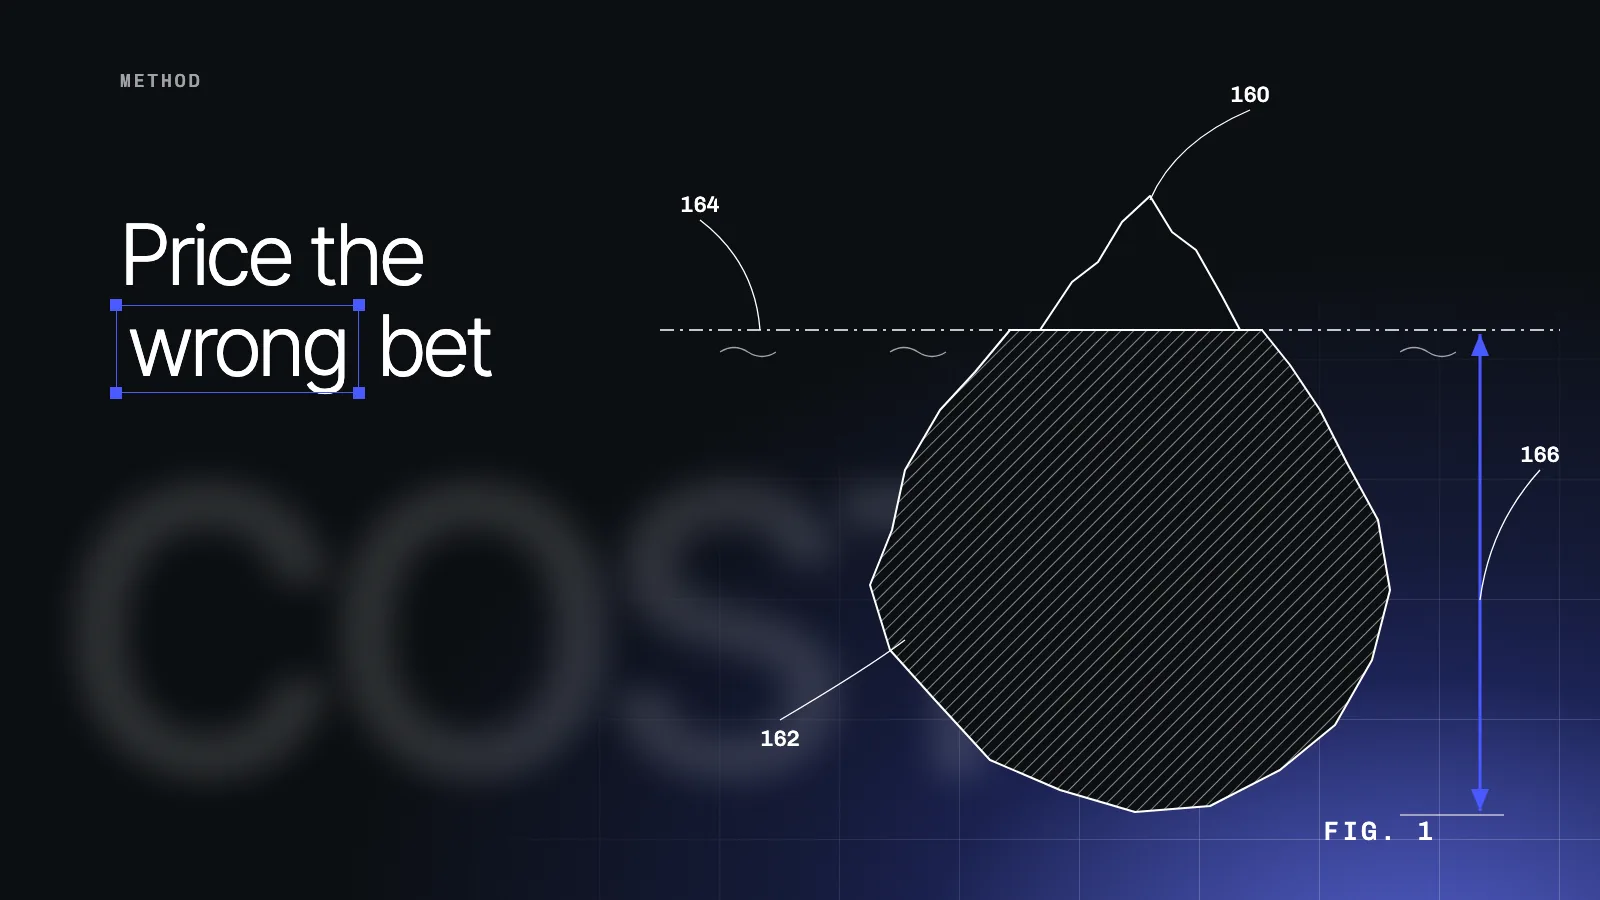
- Readiness and patent volume mislead. In the GetFocus battery radar (May 2026), all-solid-state is the most patented route at 9,628 families and still gets phase out: its rate has not moved since 2022.
- The board approves verdicts and triggers, not a ten-year shopping list. Re-read the rates every quarter and move a technology the month its trigger fires.
Put a technology on a 10-year roadmap because of how fast it improves, not because of how ready or how talked-about it is today. List every technology competing for each job your business needs done in 2036. Rank each one on improvement rate and maturity. Then give each a verdict (fund, monitor, phase out or ignore) and the trigger that would change it. Over a decade the rate decides: at 5% a year a technology gets 1.6 times better, at 50% a year 58 times better. GetFocus measures that rate from the patent citation network, validated on 150+ domains.
Why can't a 10-year roadmap just list technologies?
A list is out of date the day it is printed. What a board can approve for ten years is a set of verdicts: which technologies to fund, which to watch, which to run down, and what evidence would change each call. Every serious roadmapping method lands in the same place. Start from the outcomes the business needs, then choose the technologies that deliver them.
Write each outcome as a job, not as a technology. "Store energy cheaply in an entry-level EV." "Make ethylene without a steam cracker." Then list every technology that competes for that job, including the ones from outside your industry. The technology that disrupts a market often comes from another sector, which is exactly why it is missing from an internal longlist. The ethylene job alone has fourteen competing routes.
Which criteria decide what goes on the roadmap?
Use one scorecard for every candidate, so the technology with the loudest sponsor does not win by default. Most scorecards already cover fit, value, feasibility, risk and cost. Add the one criterion that looks forward: the improvement rate.
| Criterion | What it tells you | Where it decides the roadmap |
|---|---|---|
| Strategic fit | Does it do a job we need done in 2036? | A filter for every horizon |
| Improvement rate | How fast its performance compounds each year | Years 4 to 10 |
| Maturity (TRL) | How close it is to deployment | Years 1 to 3 |
| Feasibility | Can we build, buy or partner our way in? | The route and timing of entry |
| Cost and reversibility | What we lose if the call is wrong | The size of the first commitment |
| Risk and regulation | What could block adoption | The triggers we watch |
Maturity, feasibility, cost and risk all describe today. A ten-year roadmap is a bet on 2036, and only the rate describes where a technology is heading. That is why readiness on its own misleads: a technology readiness level tells you how ready, not how fast.
This applies to physical technologies whose progress shows up in patents: materials, chemicals, energy, mobility, devices. It is the wrong tool for choosing a software vendor, where the decision is procurement inside a technology that is already settled.
How do you rank technologies that are years away from mattering?
Measure each one's rate and plot it against its maturity. Every technology improves exponentially, each at its own stable rate. MIT measured those rates by hand for 28 technology domains, and they span about 20 times: 3% a year for milling machines, 62% a year for optical telecom. Across a ten-year roadmap that is the difference between 1.3 times better and more than 100 times better. GetFocus computes the rate from the patent citation network and has validated it on 150+ domains at R² ≈ 0.7.
Plotted together, rate and maturity separate technologies that a scorecard would rank side by side. This is the GetFocus Automotive Technology Strategy Radar on EV battery chemistries, May 2026 readout:
| Route | Improvement rate | Maturity (TRL) | Verdict |
|---|---|---|---|
| Sodium-ion | ~125%/yr | 8, near-commercial | Fund |
| Lithium-sulfur | ~70%/yr | 6, relevant environment | Fund |
| LFP / LMFP | ~65%/yr | 9, proven | Fund |
| All-solid-state | ~53%/yr | 6, relevant environment | Phase out |
| NMC / NCA | ~47%/yr | 9, proven | Phase out |
| Lithium-metal | ~46%/yr | 6, relevant environment | Phase out |
The GetFocus platform · EV batteries
Same maturity, opposite verdicts
Lithium-sulfur and all-solid-state both sit at TRL 6. The rate puts one in fund and the other in phase out. Hover a route for its history.
GetFocus platform · Battery Technologies · 31,644 patent families · Full radar and verdicts
Two of those verdicts would surprise a readiness scorecard. NMC is proven and widely deployed, and it still gets phase out, because it is the slowest-improving mature route. All-solid-state is the most heavily patented route in the set, at 9,628 families, and its rate has not moved since 2022. Lithium-sulfur sits at the same maturity and gets fund, on a faster rate. The filings are not buying progress. See the full radar.
Patent volume misleads the same way across decades. In the GetFocus mobility backtest, hydrogen out-filed every other powertrain for 25 years while batteries improved faster from the first data point in 2001: 54% a year against 21%. A roadmap built on filing activity would have put fuel cells at its centre. Automakers and governments sank $20B+ into exactly that.
What goes in each horizon: deploy now, pilot, or keep in R&D?
Most roadmaps split the decade into three horizons: commit in years 1 to 3, scale and pilot in years 4 to 7, hold options in years 8 to 10. Rate and maturity tell you which horizon a technology belongs in, so the split stops being a matter of taste.
| Rate vs the domain median | Maturity | Verdict | What it means for the roadmap |
|---|---|---|---|
| Faster | TRL 6 to 9 | Fund | Deploy or scale now, years 1 to 3 |
| Faster | TRL 1 to 5 | Monitor closely | Pilot and keep in R&D, years 4 to 7 |
| Slower | TRL 6 to 9 | Phase out | Stop new investment; hold it where it still pays |
| Slower | TRL 1 to 5 | Ignore | Leave it off; recheck at the yearly refresh |
The split is relative. The median is taken over the technologies competing for the same job, so every verdict compares like with like.
How often should a 10-year roadmap be revisited?
Quarterly, with a full refresh once a year, and immediately when a trigger fires. A date says "adopt in 2031". A trigger says what has to be true first: pack-cost parity with the incumbent, a second major carmaker adopting the route, a shift in the rate of the bottleneck material. The GetFocus sodium-ion radar runs on exactly those three triggers, so the decision moves in the month the evidence moves, not at the next planning cycle. More on replacing dates with triggers.
Behind that cadence sits a system, not a team rereading reports. GetFocus reads every new patent, recomputes every rate each month and re-scouts the domain each quarter for routes that were not on the list.
Is it worth hiring a consultancy for a technology roadmap?
Pay for outside help where it adds evidence your team cannot produce, not for a binder. A consultancy brings structure, a neutral facilitator and a fresh view of the options, and those are real gaps in a stretched team. What a study delivers is a snapshot: six months and six figures for a document that is stale the day it lands, on a decision that runs for ten years.
The alternatives are not cheaper versions of the same study. Keep ownership of the roadmap inside, with the experts who will defend it, and buy the evidence: a rate and a maturity for every competing technology, read from the global patent record and kept current. Matteo Munari, Head of Technology at Alfa Laval, calls GetFocus "an invaluable tool for validating the insights of our in-house experts". For a board deadline, a Decision Sprint takes one decision from uncertainty to a board-ready roadmap in four to six weeks.
FAQ
How far ahead can a technology roadmap look?
Ten years is realistic for the ranking, not for dates. Each technology improves at its own remarkably stable rate, so which technology overtakes which holds far longer than any forecast of a launch year. Commit to years 1 to 3, pilot in years 4 to 7, and hold options with triggers beyond that.
What is the three horizons model?
A way to split a long roadmap into near-term commitments, mid-term scaling and pilots, and long-term options. Place each technology by its improvement rate and maturity, not by how exciting it sounds.
Is TRL enough to choose technologies for the roadmap?
No. TRL says how close a technology is to deployment, which places it in time. The improvement rate says whether it will be worth deploying by then. Use both.
Should the board approve every technology on the roadmap?
No. The board approves the direction, the verdicts for technologies that need money now, and the triggers for the rest. Individual technologies then move on evidence, without reopening the strategy.