Winning Technologies Leave Clues. Here Is How to Read Them.

Most assumptions about the future of technology share one flaw. They treat prediction as a matter of judgment: experienced people making informed guesses about which direction things are likely to go.
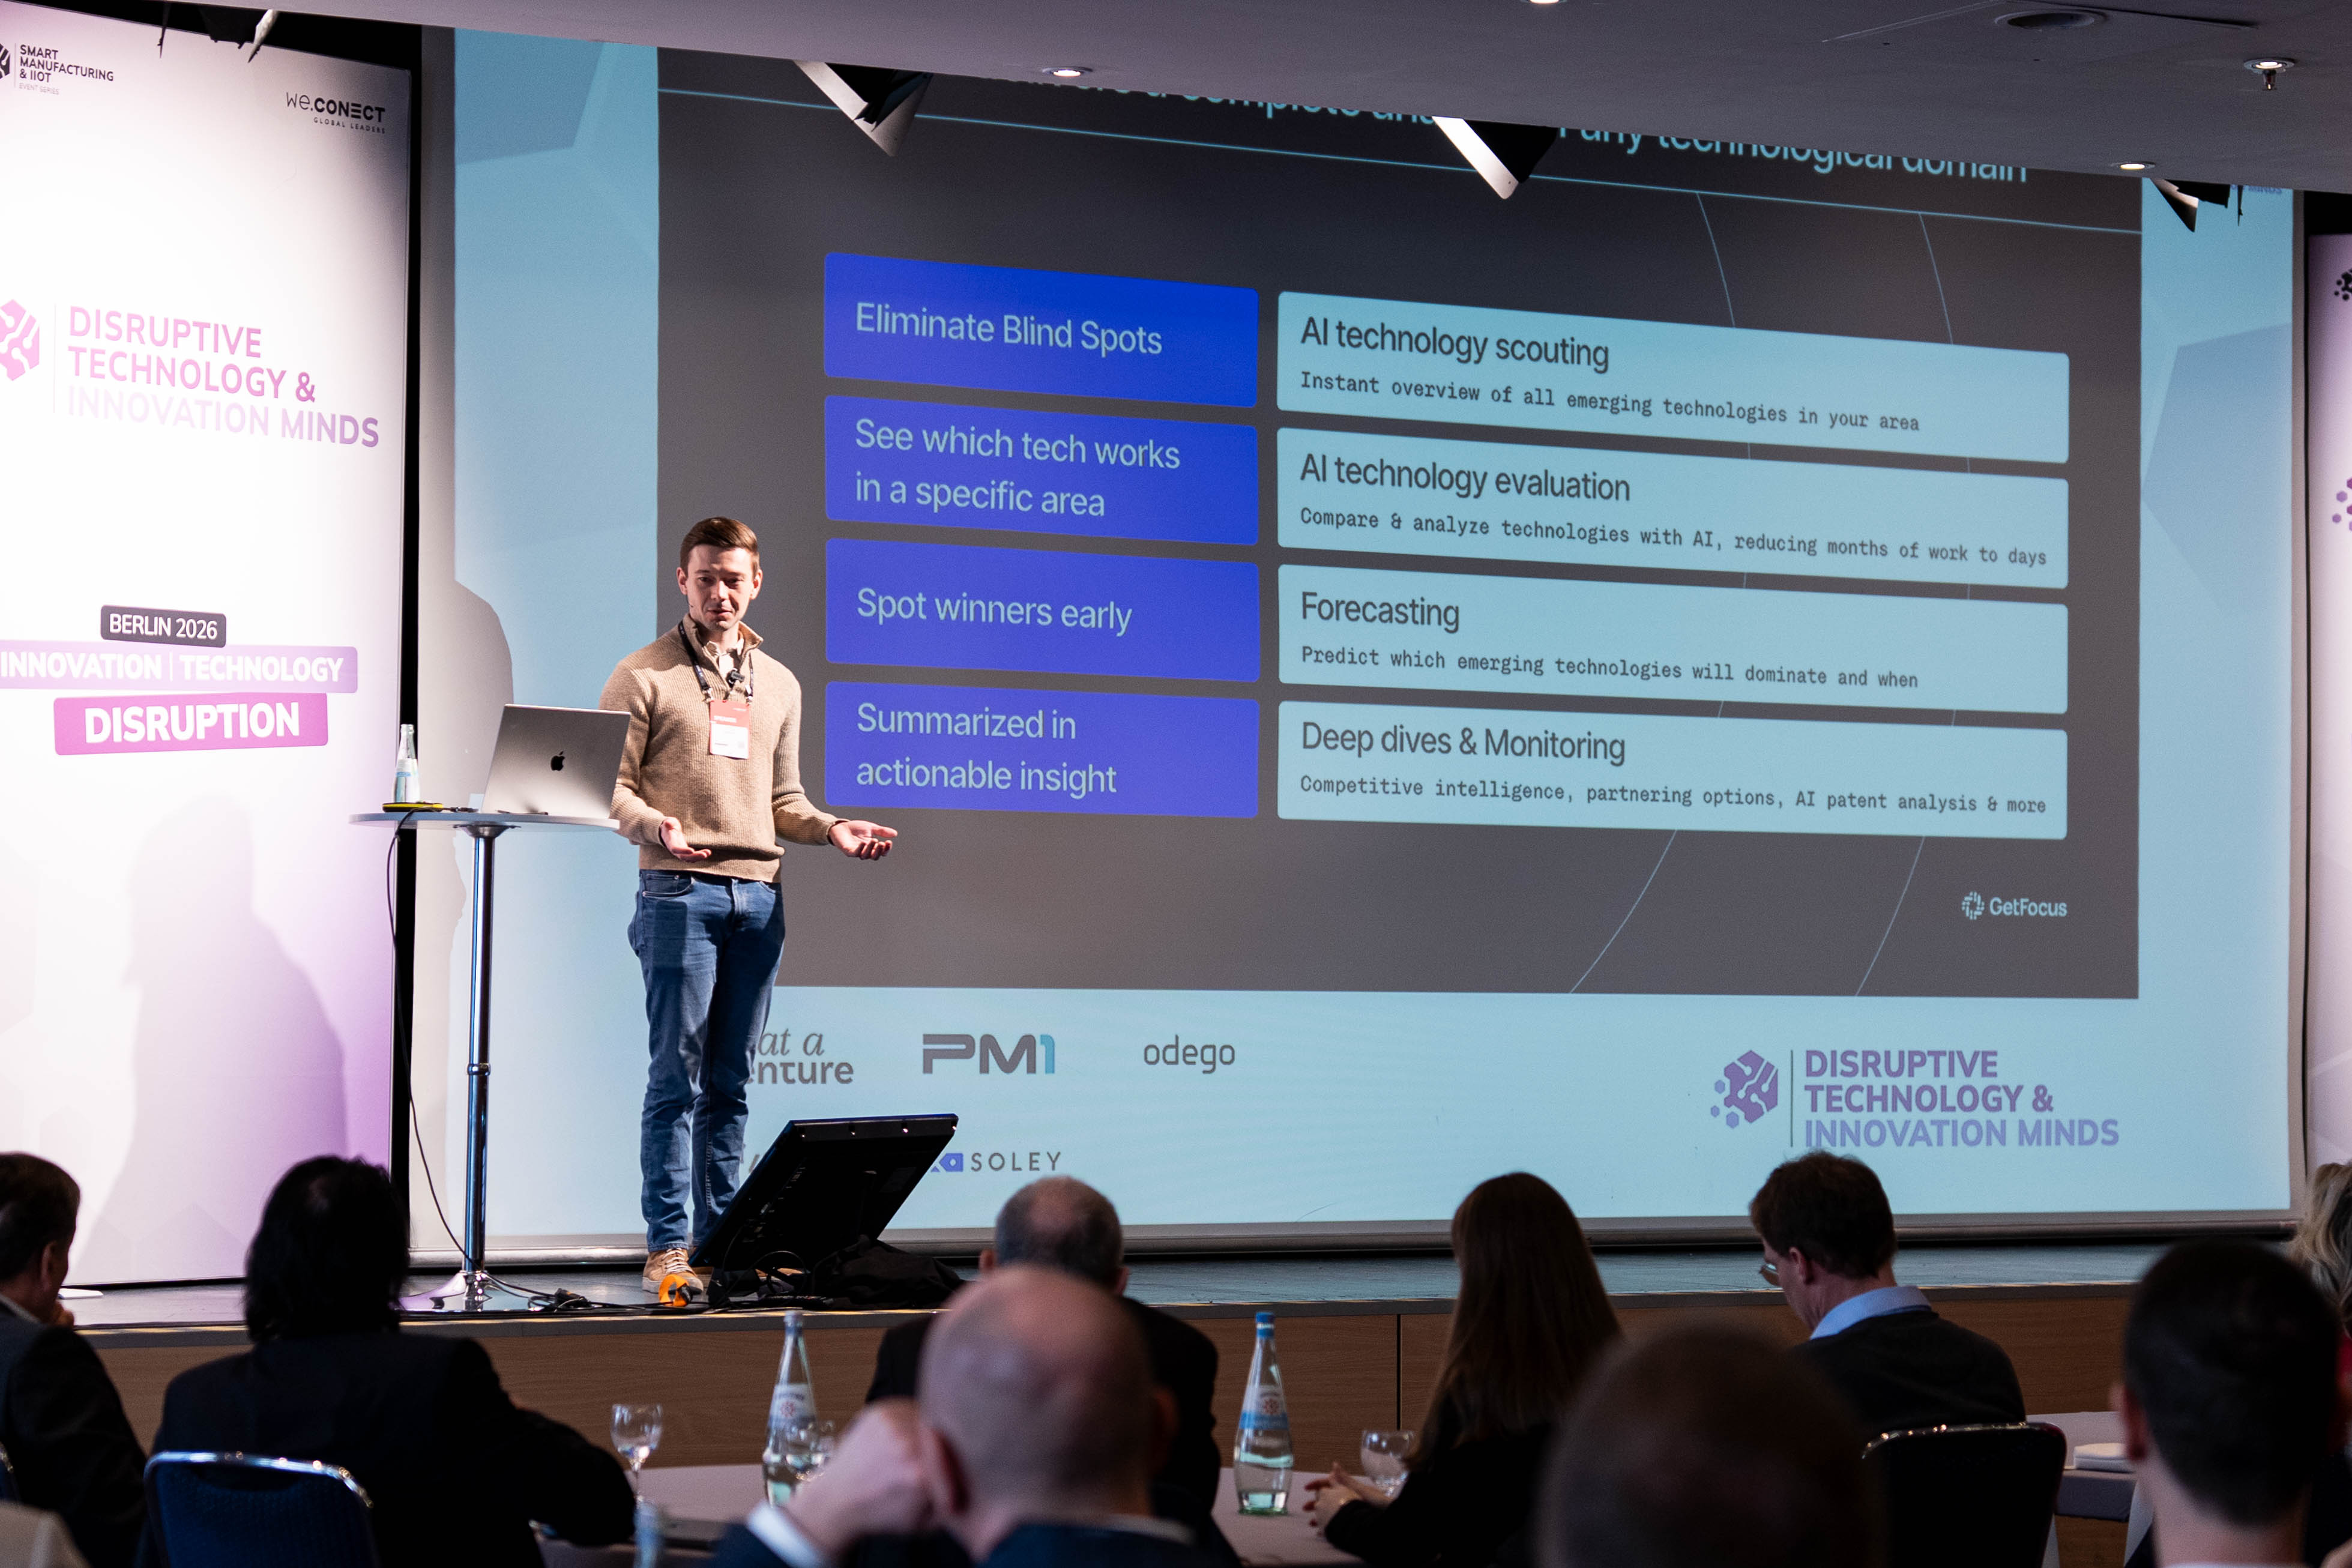
Martina Dinardo opened her talk at DTIM 2026 in Berlin with a different premise. Winning technologies do not simply emerge. They leave clues. Measurable, detectable signals embedded in patent citation data that reveal how fast a technology is actually improving, long before that improvement becomes visible in the market or obvious to the industry at large.
The argument is not that prediction is easy. It is that for the first time, it can be turned from speculation into science. This post walks through the full case: the problem that makes technology evaluation so difficult, why the tools most organisations currently rely on are answering the wrong question, and how reading the right signal changes the quality of every technology bet.
The Problem Every R&D Leader Recognises But Rarely Names Precisely
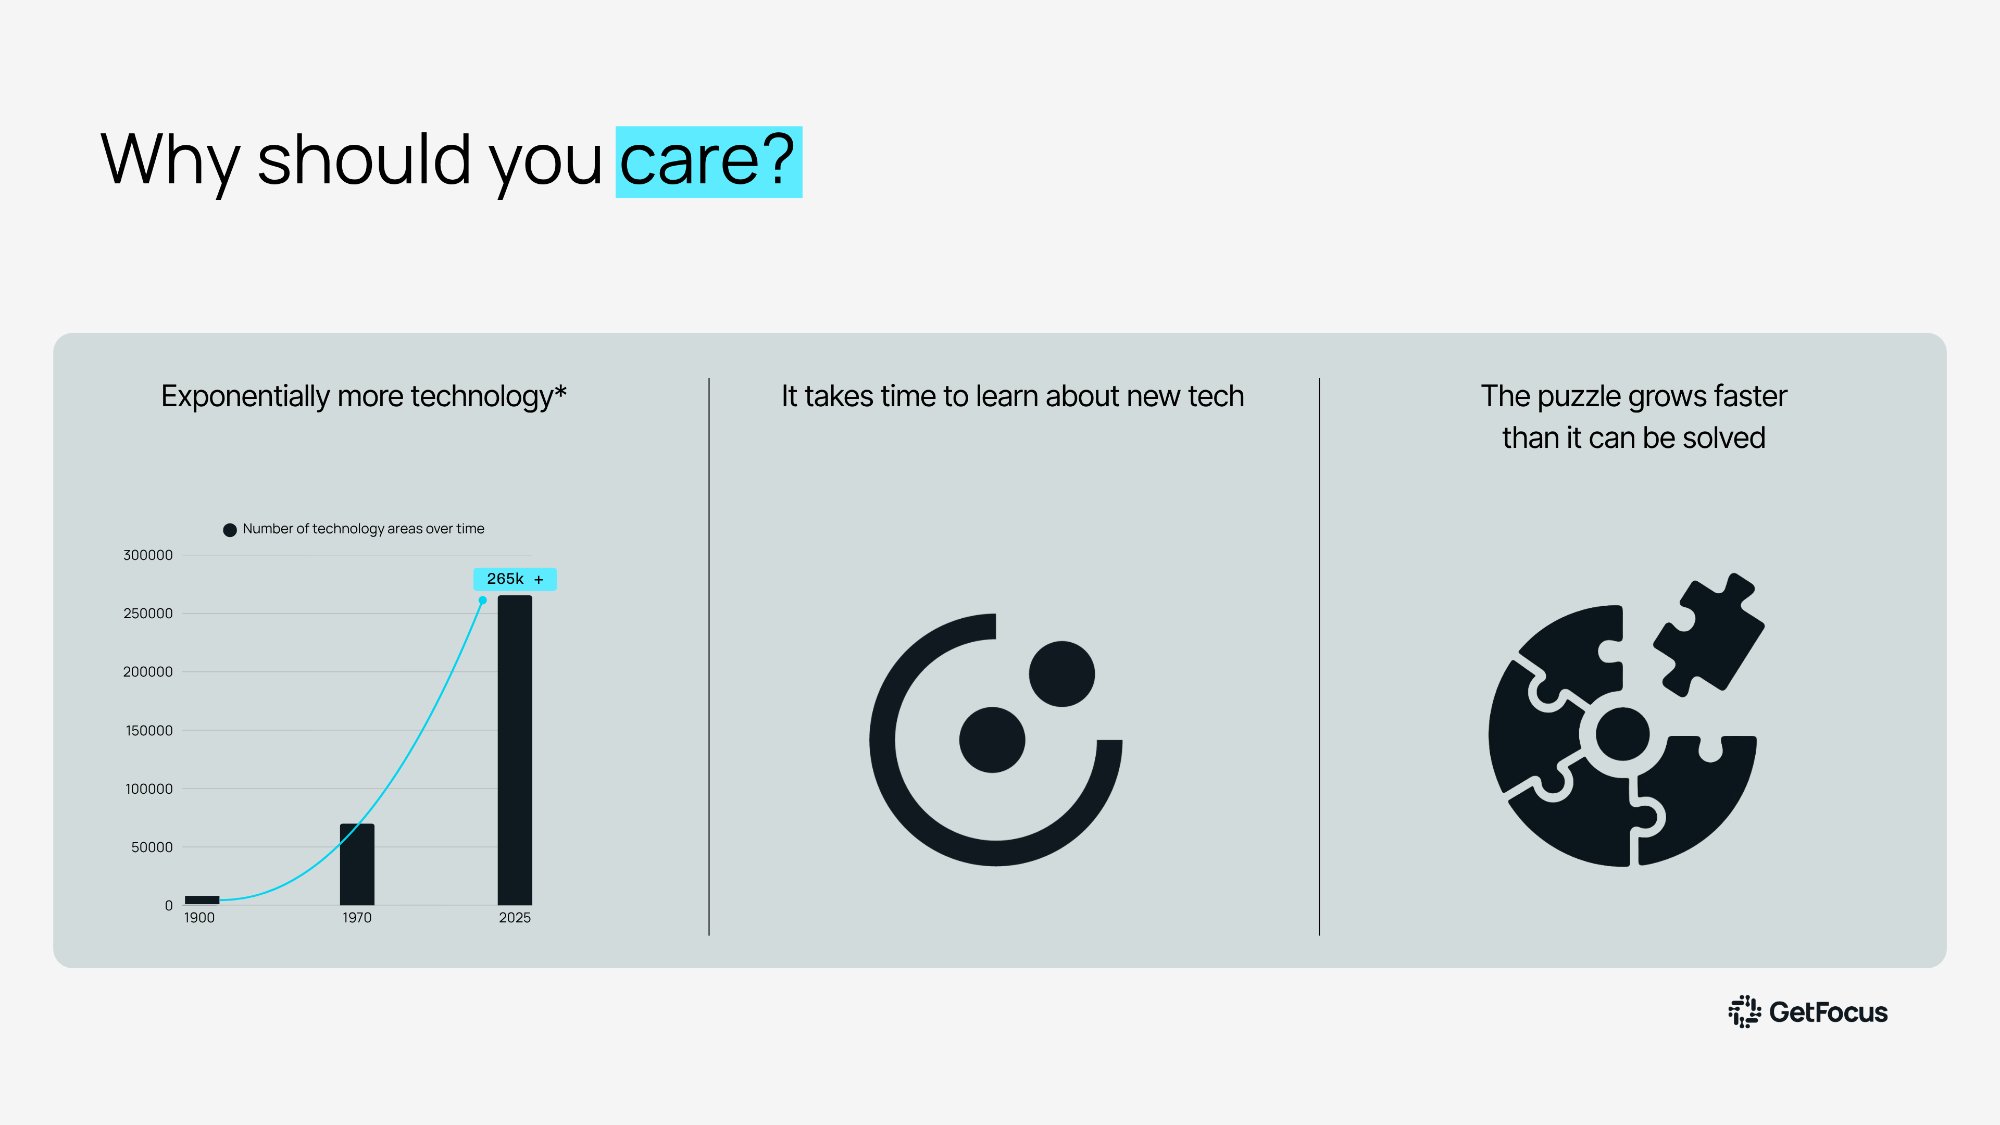
Technology is not just getting more complex. It is getting more voluminous, faster than anyone can track.
The number of distinct technology areas tracked globally has grown exponentially. 265,000 and rising as of 2025, up dramatically from a few decades ago. Every year brings new domains, new competing approaches, new lab-stage research that may or may not be relevant to a strategic decision being made right now with incomplete information.
Human capacity to process this has not scaled to match. Experts can cover a domain. They cannot cover all of them. Even a large internal team will have gaps: areas where coverage is thin, where the judgments being made are based on outdated assumptions about what is technically possible, or where no one is watching at all.
The result is a puzzle that grows faster than anyone can solve it. Not because organisations are not trying hard enough. Because the volume of relevant information has simply outpaced every traditional method for dealing with it. There is too much to track, not enough time to track it properly, and a real cost to every decision made in that gap.
The Two Tools Most Organisations Rely On, and Where Each Falls Short
When organisations try to close that gap, they tend to reach for one of two approaches. Both are reasonable starting points. Both have structural limits that no amount of effort resolves.
The first is internal expertise. This is right and worth keeping. But expertise has a built-in ceiling. Experts know the technologies they already work with. They are far less likely to champion the ones that might eventually replace them. Not because they are not thorough, but because expertise builds attachment. A specialist shaped by years of work in one direction carries a perspective that is hard to separate from the work itself. Not a criticism. Far from it. But that is how knowledge works.
The second is trend monitoring. There is no shortage of platforms offering to track the technology landscape: investment totals, patent filing volumes, startup counts, research publication rates. The challenge is what these platforms actually measure. All of them, in the end, are counting. And counting is a reliable way to identify what is popular.
"Just because everyone is moving in a certain direction does not mean it is the right direction. It just means that is where the crowd is going."
The signal you actually need is not popularity. It is rate of improvement. Those two things can look identical for years, right up until one of them collapses.
A Four-Step Process That Addresses Both Coverage and Accuracy
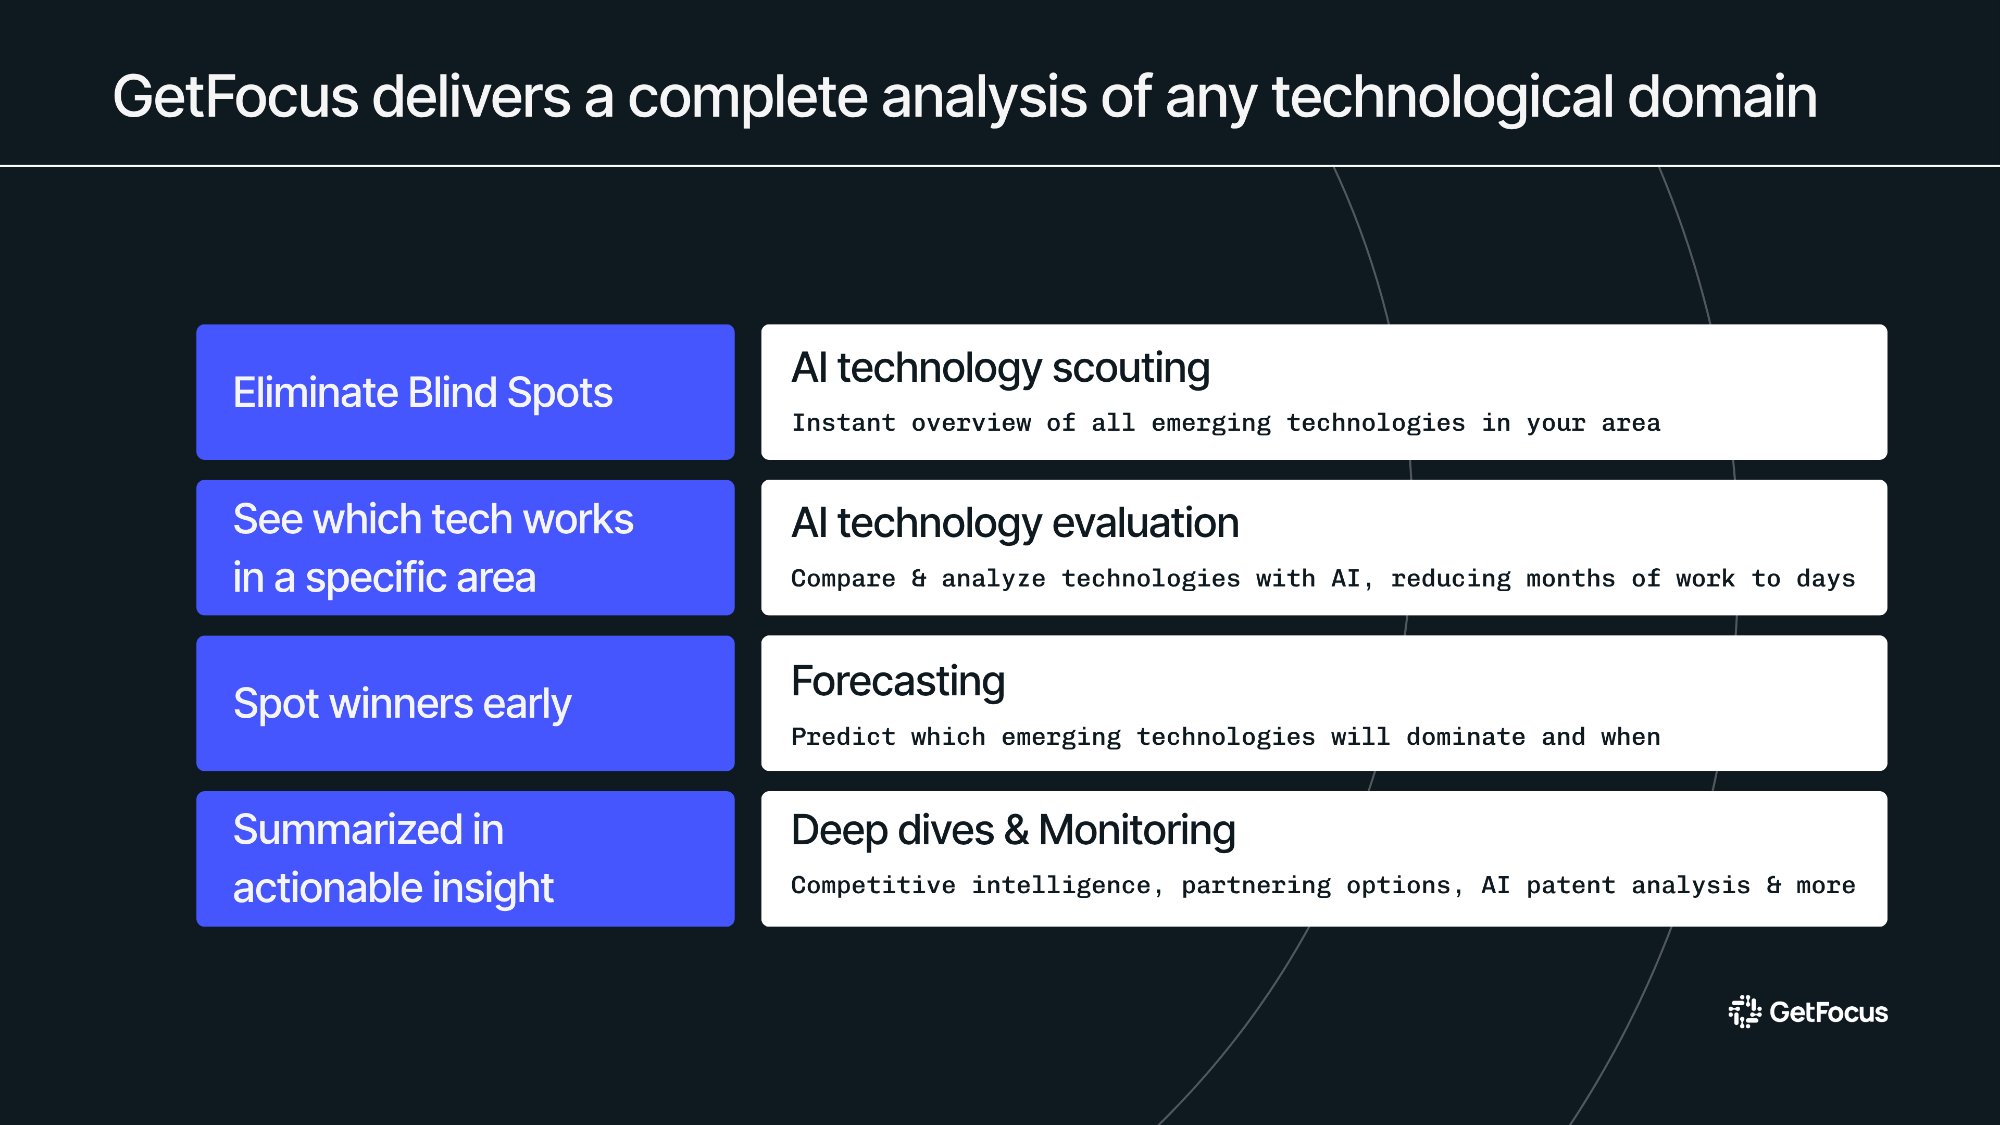
GetFocus addresses both problems through a four-step process built on AI agents and a forecasting methodology co-developed with MIT over several years.
The third step is what makes everything else possible. If you can measure how fast each competing technology is improving, you can identify which one is on a trajectory to dominate. Years before the market can see it.
The Science: Two Metrics Hidden in Patent Data That Predict the Future
The forecasting step is grounded in 30 years of MIT research into what actually determines which technology wins.
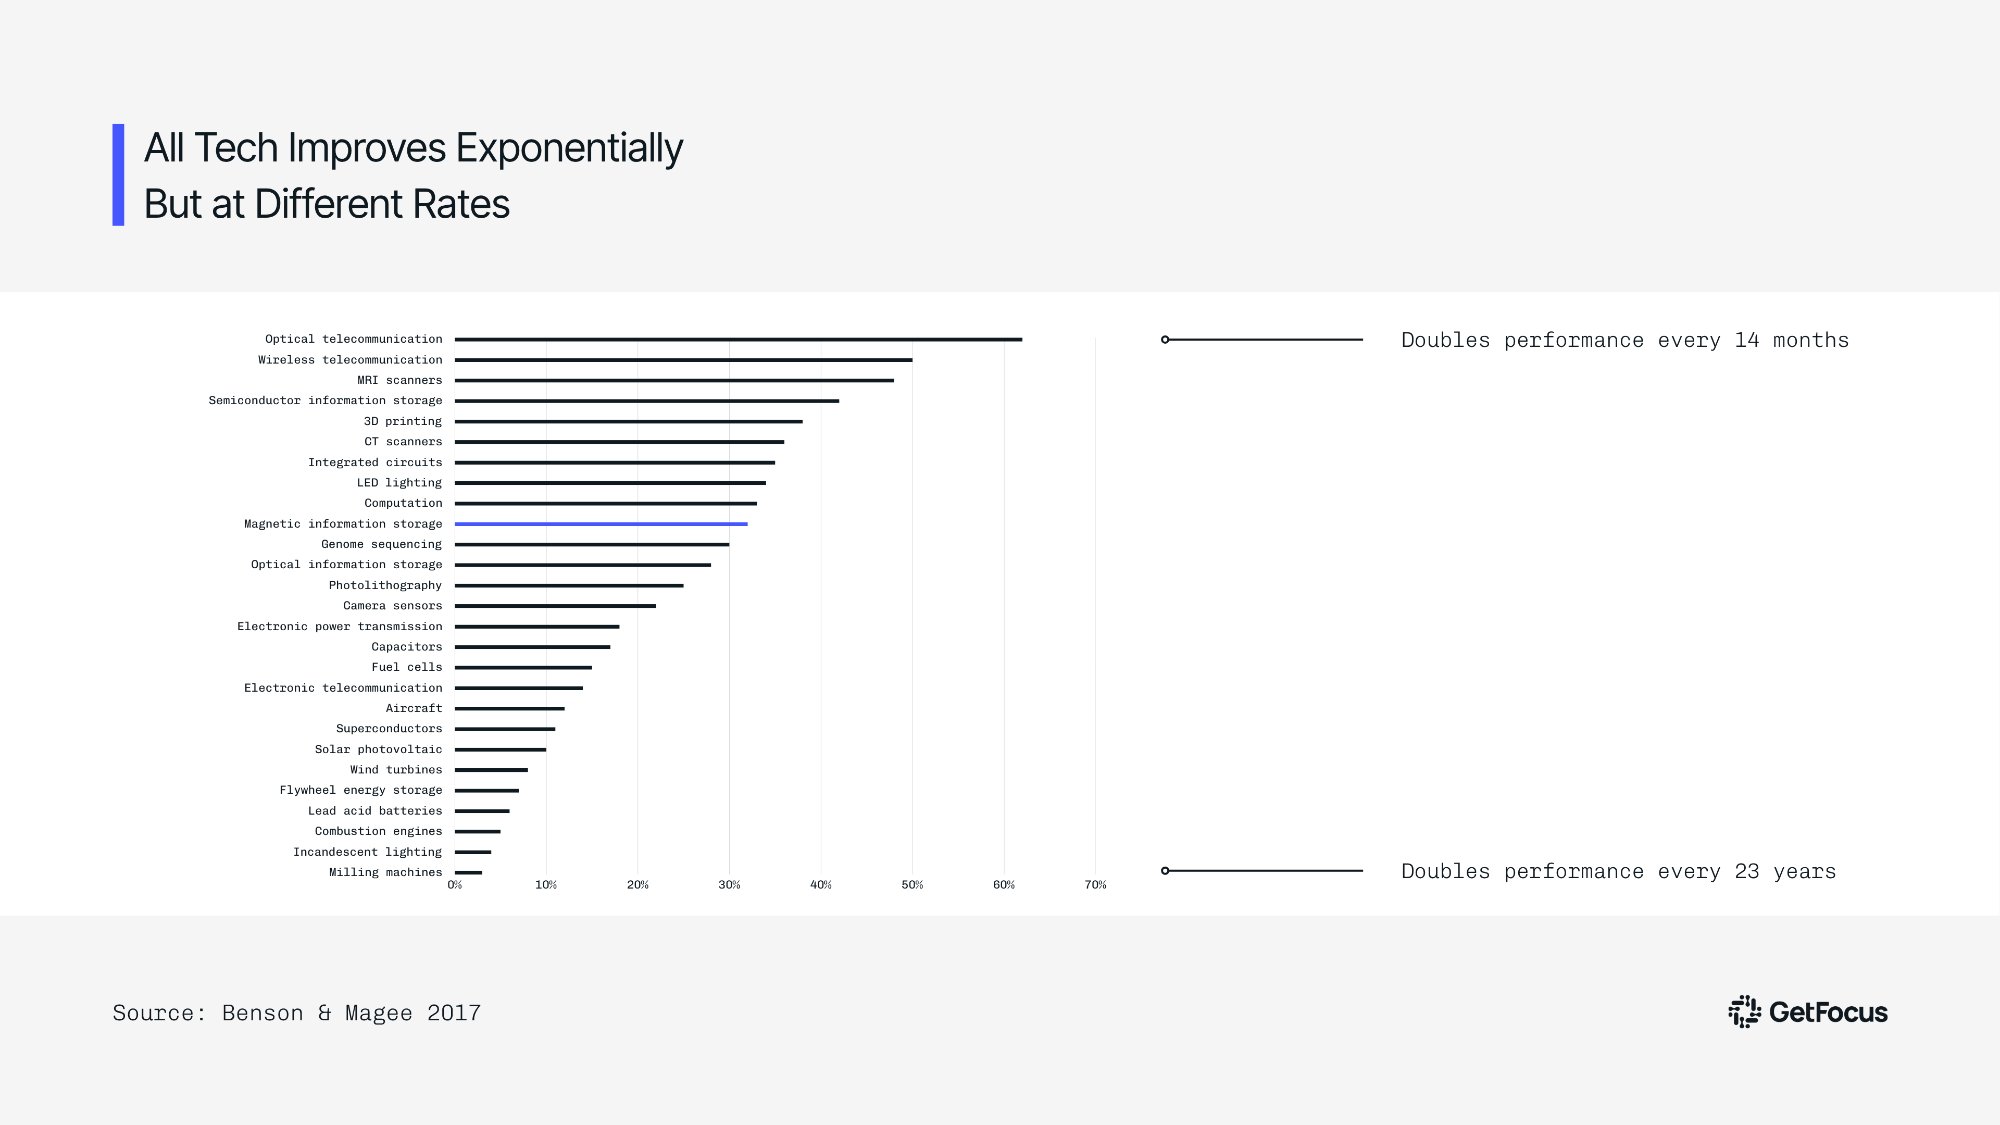
The researchers spent years empirically measuring how technology domains evolved over time, tracking performance and cost improvements across 28 fields. What they found was consistent across every single domain: technology improves exponentially, at a stable and measurable rate. The differentiator is how fast.
Optical telecommunications doubles its performance every 14 months. Milling machines take 23 years to achieve the same doubling. Both are on exponential curves. The strategic difference between them is enormous, and it is detectable years before the market reflects it.
The problem the MIT team encountered was that measuring improvement rate empirically requires years of data collection after the fact. By the time the measurement was complete, the market had already moved. GetFocus solved this by identifying two metrics within patent citation networks that predict improvement rate before it shows up in performance data.
Cycle time measures how long it takes a field to produce its next generation of meaningful invention. Knowledge flow measures how much that new invention gets cited by subsequent steps. Fast-improving technologies have short cycles and high citation rates. Slow-improving ones have long cycles and sparse citations. Together, these two numbers make the trajectory visible years ahead of the market.
The Case Study: Billions Invested in the Wrong Direction for Two Decades
The automotive case study is the clearest illustration of what reading improvement rate signals actually means at scale.
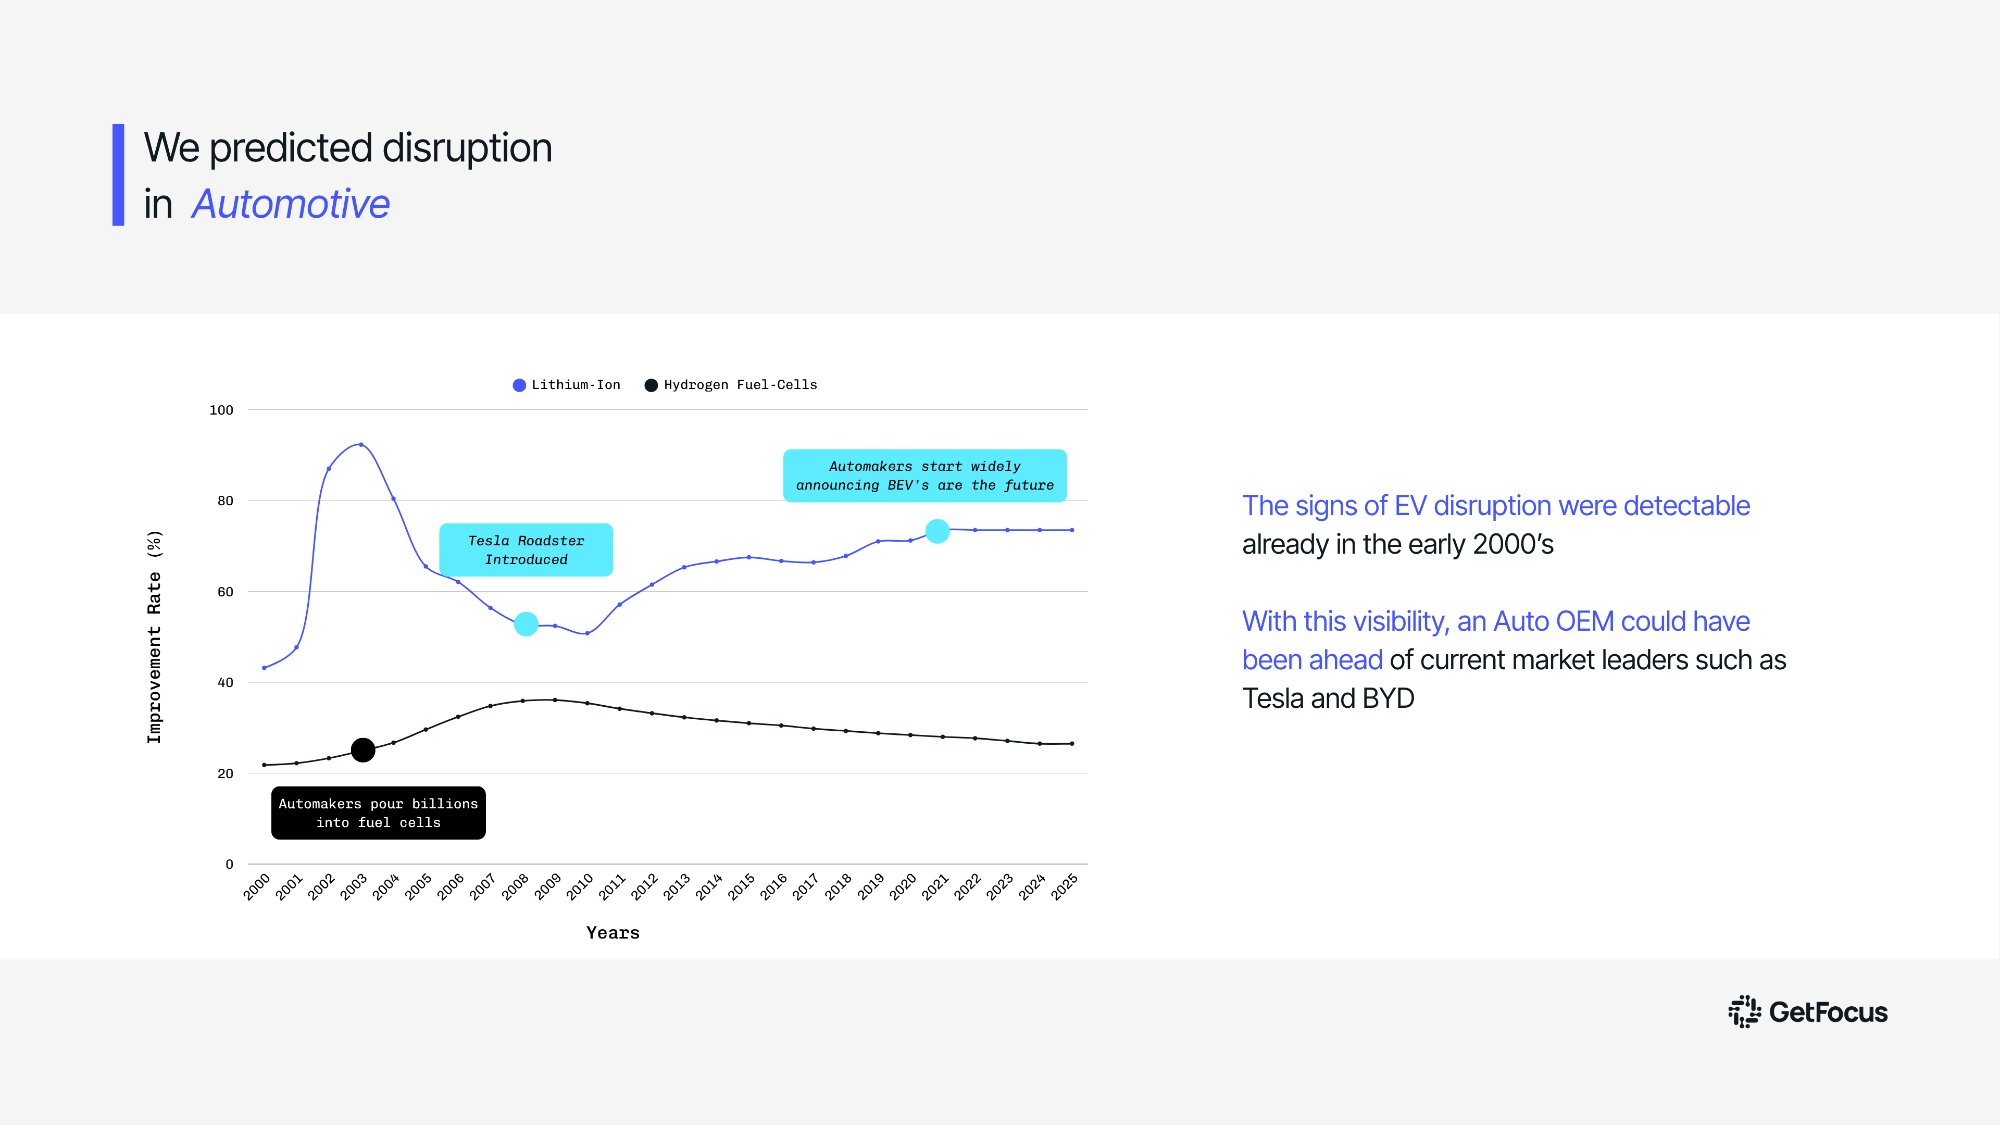
In the early 2000s, every major automotive manufacturer made a significant bet on hydrogen fuel cells. The bet was reasonable given what was visible at the time. Hydrogen had momentum, investment, and widespread industry consensus. By any trend monitoring measure, it was the technology to watch.
The improvement rate data said something entirely different. From the early 2000s, lithium-ion batteries were improving dramatically faster than hydrogen. The gap was detectable, measurable, and growing. Even when Tesla introduced the Roadster in 2009 and early market signals began pointing toward electric vehicles, most manufacturers continued allocating significant capital toward hydrogen. For many, the public admission that they had made the wrong technology choice did not come until around 2020.
"The signal was already in the data from the early 2000s. The instruments to read it were not yet available."
The same pattern holds across every domain examined: solid-state drives versus hard disk drives, online versus offline payment, and others. In every case, the fastest improving technology ended up dominating. Without exception. The future was in the data. It just required the right methodology to extract it.
Technology Forecasting Is Not Speculation. It Is a Science.
That is the point Martina closed with at DTIM 2026. Forecasting has long been associated with a certain degree of guesswork. GetFocus has made it measurable, repeatable, and objective. Not a better version of expert opinion. A fundamentally different kind of instrument.
Winning technologies leave clues. They always have. The improvement rate signal is visible years before market consensus shifts, years before the billions get invested in the wrong direction, and years before the cost of a mistaken bet becomes undeniable.
GetFocus makes that signal readable. Give us a domain you are currently navigating, and we will show you what the improvement rates say. Worst case, you leave with free intelligence.

Ready to see it in action?
Discover how GetFocus can transform your strategic decision-making process today.
