The Fastest Technology Always Wins. Here Is How to Know Which One.
There is a claim Jard van Ingen makes at the start of every talk that tends to get pushback.
The technological future is more predictable than you think.
Not as a feeling. Not as a trend. As a measurable, repeatable pattern derived from 200 million patents, validated across dozens of technology domains, and co-developed with MIT. No exceptions found yet across any field where it has been tested.
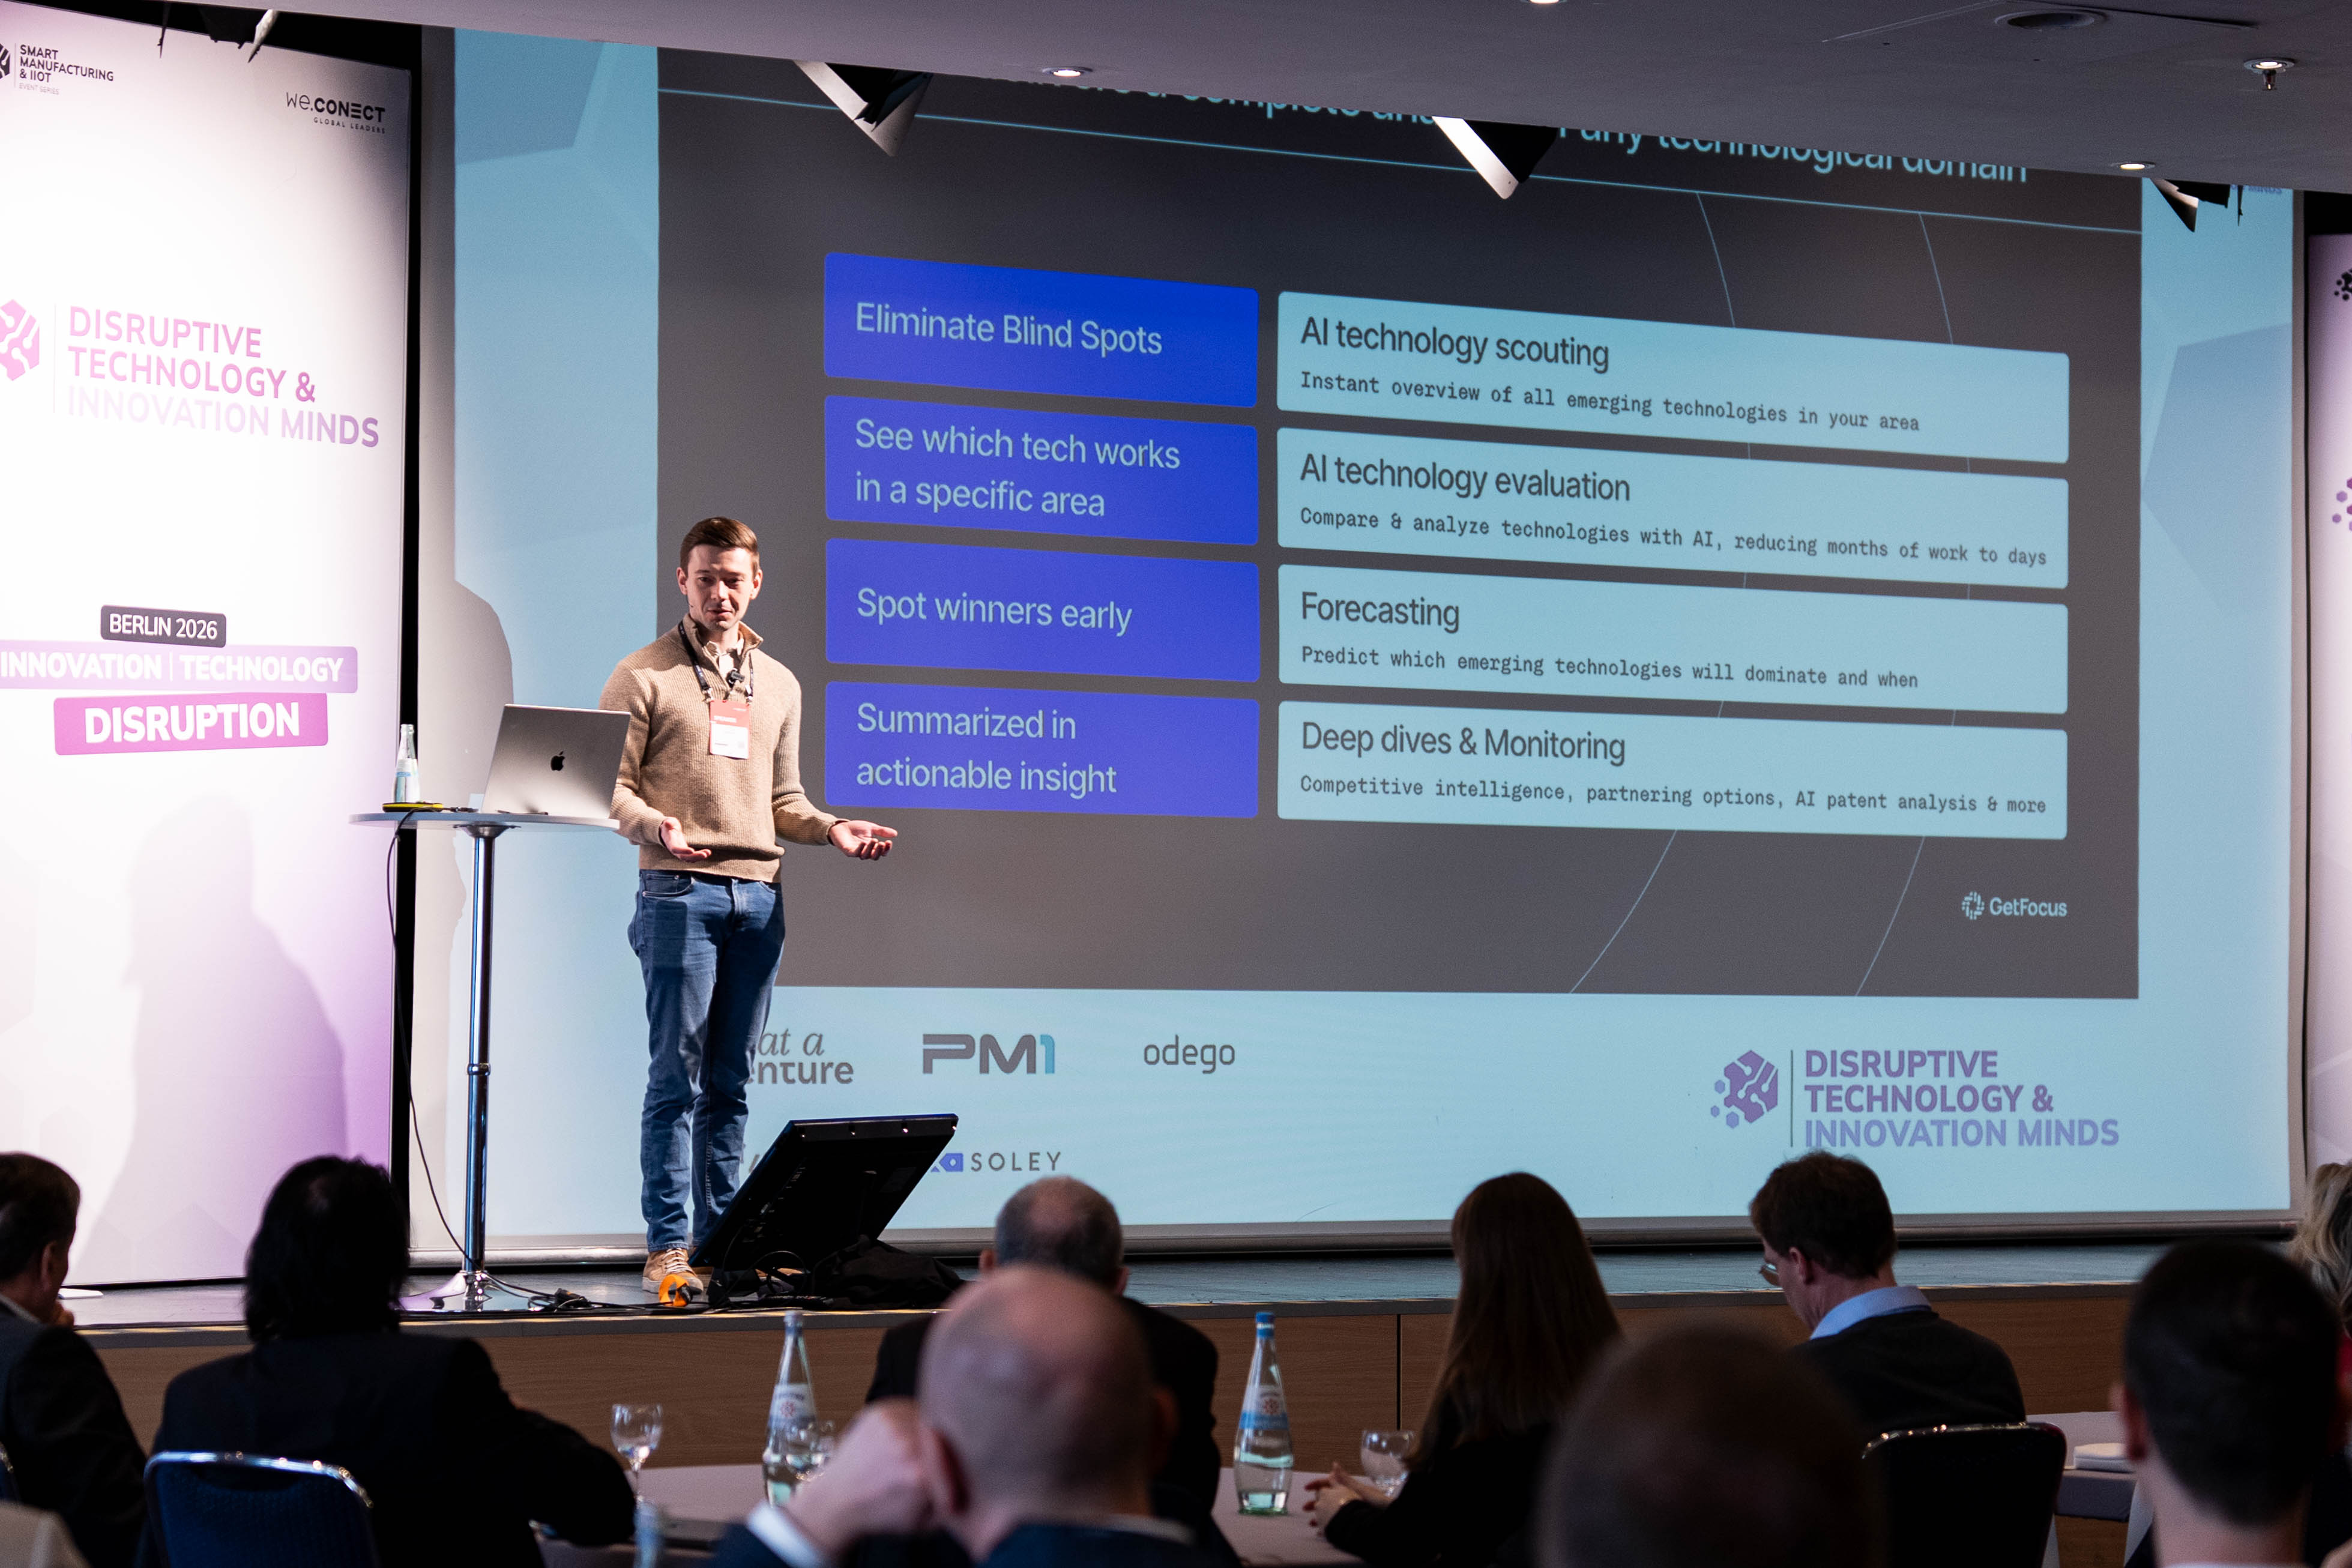
That is the argument Jard made on stage at DTIM 2026 in Berlin. This post walks through the full logic: why the problem is getting harder, why the tools most organisations rely on are answering the wrong question, and how measuring technological improvement rates changes what is possible for anyone responsible for a technology strategy.
The Problem Is Structural, Not Solvable by Effort Alone
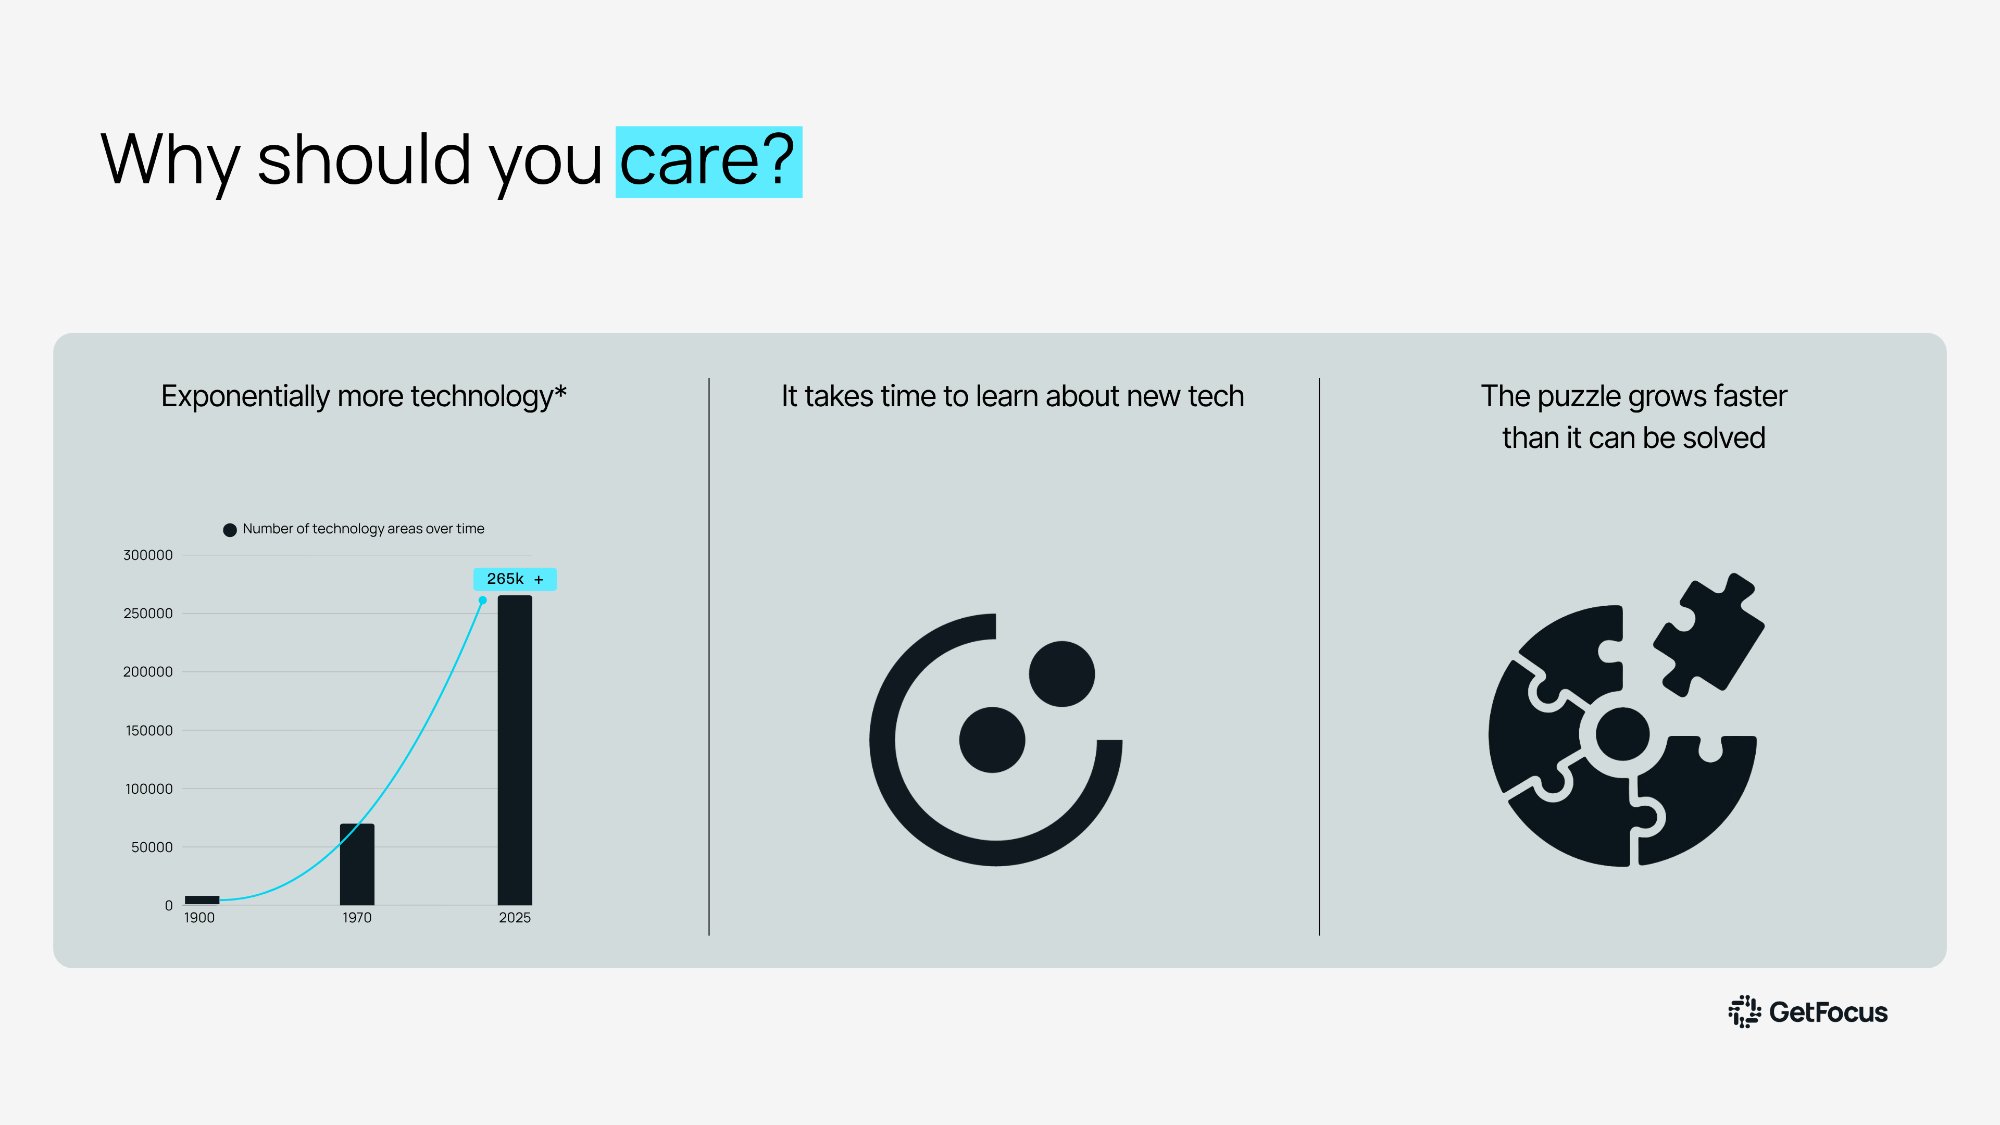
If you have sat in an R&D leadership meeting in the last decade, you know the feeling. There is more emerging technology than there is time to evaluate it. And the gap is not staying stable.
The number of distinct technology areas tracked globally has grown exponentially. From a handful of relevant domains a few decades ago to over 265,000 today. The curve is not flattening. Every year brings more competing approaches, more emerging materials, more early-stage research arriving from directions that were not on anyone's roadmap twelve months ago.
Human evaluation capacity has not scaled at the same rate. You cannot hire exponentially more experts. You cannot read exponentially more papers. The puzzle, as Jard puts it, is growing faster than you can lay down the pieces. And from this point forward, it is going to get exponentially worse.
This is not a resource problem that more budget resolves. It is a structural mismatch between the rate at which the technology landscape expands and the tools available to navigate it.
Why the Two Most Common Approaches Fall Short
Most large organisations have tried to solve this with one of two approaches. Both are reasonable. Both have fundamental limits.
The first is internal expertise. This is genuinely valuable and not something to move away from. But expertise has a ceiling that no amount of hiring resolves. Your experts tend to know the technologies you are already building. Not the ones that might replace them. And even when coverage extends into adjacent areas, expertise carries opinion built over years. A researcher who has spent a career in one direction is not the most neutral evaluator of what might make it obsolete.
"It is very difficult to find a battery guy that likes hydrogen, or the other way around. Not a criticism. Far from it. But that is how knowledge works."
The second approach is trend monitoring. There is no shortage of platforms here, tracking investment flows, patent filing volumes, startup activity, research publications. The problem is not the data. The problem is what it measures. All of these tools, in the end, are counting. And counting is a reliable way to identify what is popular.
History is full of popular ideas that turned out to be completely wrong. Just because a lot of people are doing something does not mean you should. It just means that they are.
A Four-Step Process Built to Handle Both Problems
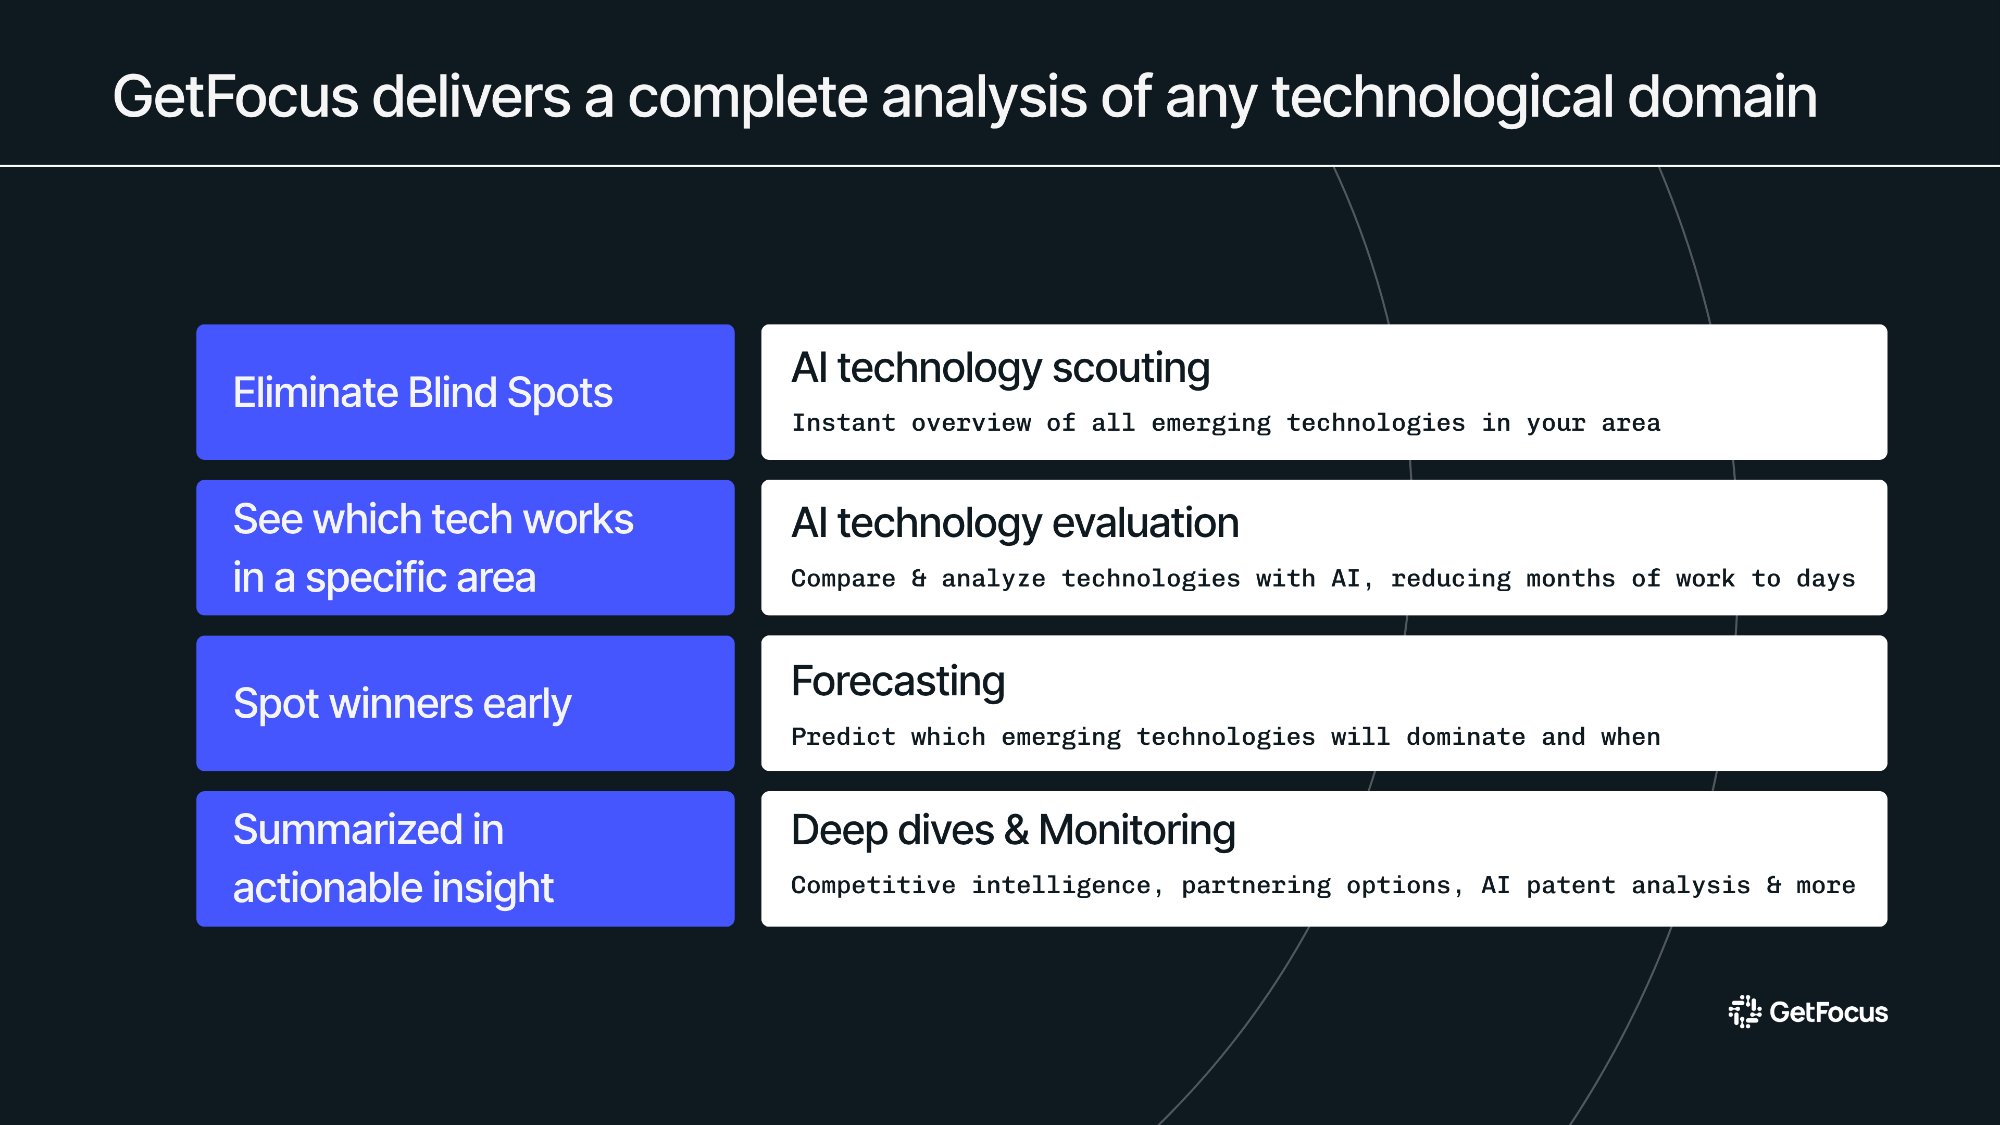
The GetFocus approach addresses both the coverage problem and the accuracy problem through four steps, each handled by AI agents built specifically for scale.
Step one is technology scouting: a comprehensive sweep of every emerging technology relevant to a given challenge, without prior assumptions. The goal is to eliminate blind spots from the start by ensuring nothing is filtered out before the analysis begins.
Step two is evaluation against specific criteria. Technical maturity, performance thresholds, applicability to the actual use case. This step narrows a long list to the technologies worth taking seriously, saving the depth of analysis for what genuinely matters.
Step three is forecasting. This is where GetFocus diverges from every other platform on the market. Rather than counting activity, this step measures how fast each technology is actually improving. That single shift is what makes accurate prediction possible.
Step four is deep dive and monitoring: competitive intelligence, white space mapping, and live triggers that alert the moment a technology crosses a threshold that demands action.
The Science: Why Improvement Rate Is Both Predictable and Decisive
To understand why improvement rate is predictable, it helps to understand where the signal comes from.
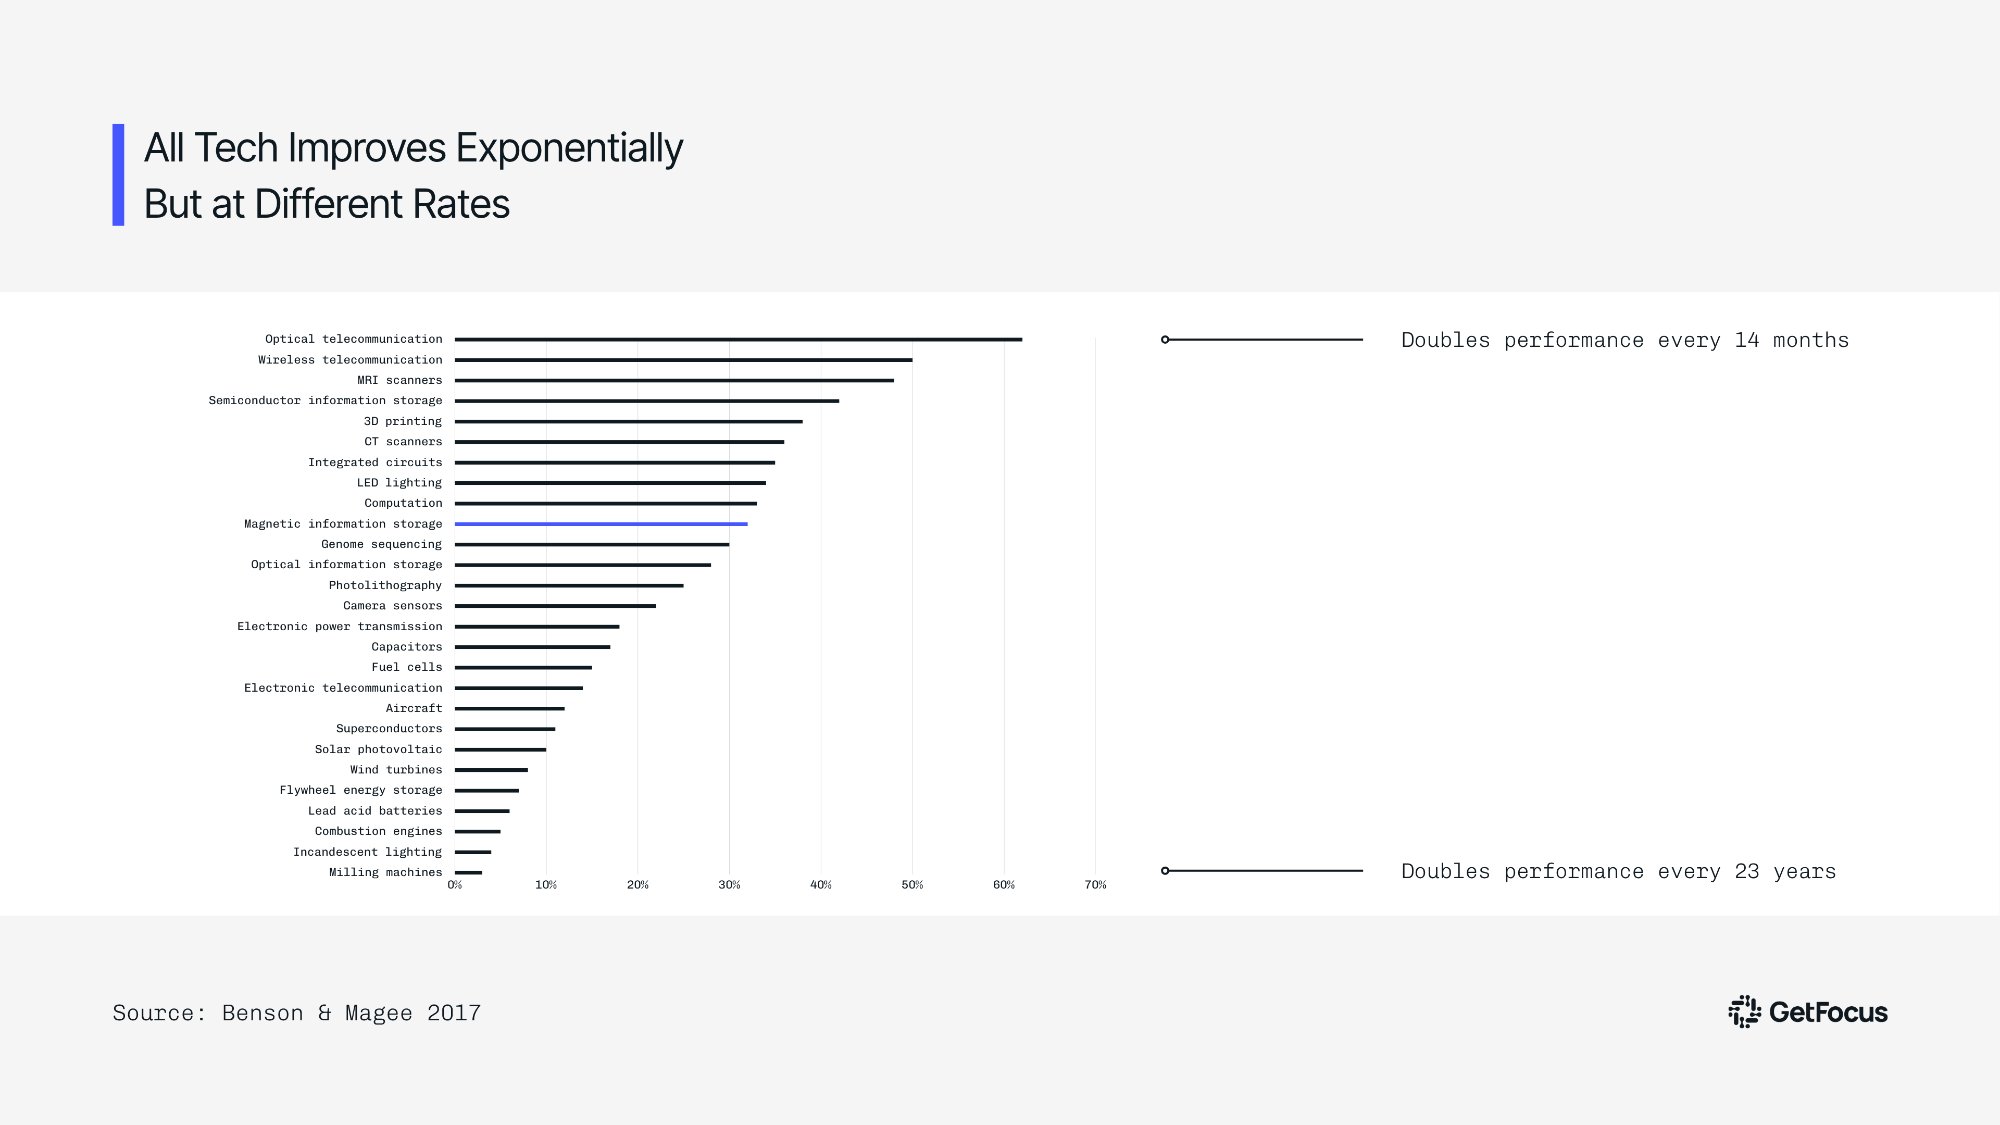
GetFocus co-developed its forecasting methodology with MIT researchers who had spent 30 years on a deceptively simple question: why do some technologies win and others disappear? The team empirically measured how 28 technology domains evolved over time, tracking performance and cost year by year. What they found was consistent across every domain. Technology improves exponentially, and it does so at a stable, measurable rate. The only variable is how fast.
Optical telecommunications doubles its performance every 14 months. Milling machines take 23 years to achieve the same doubling. Both are on an exponential curve. The difference in strategic terms is enormous, and it is detectable years in advance.
Two metrics from patent citation data turned out to be the key predictors. Cycle time measures how long it takes a field to produce its next generation of meaningful invention. Knowledge flow measures how much that new invention gets cited by subsequent steps. Fast-improving technologies have short cycles and high citation rates. Slow-improving ones have long cycles and sparse citations. Once you can measure both, the trajectory becomes visible long before the market can see it.
The Case Study That Makes the Stakes Concrete
The batteries versus hydrogen fuel cells case makes the stakes concrete.
NMC Batteries Were Always Improving Faster.
The Signal Was There Since 2001.
Annual improvement rate (%) by publication year — lithium-ion NMC vs. hydrogen fuel cells

In the late 1990s and through the early 2000s, every major automotive manufacturer poured billions into hydrogen fuel cell development. The industry consensus was strong. Investment was substantial. By any trend monitoring measure, hydrogen was the direction to watch.
The improvement rate data told a different story. From the early 2000s onward, lithium-ion batteries were improving dramatically faster. Not marginally faster. The gap was visible, measurable, and growing. Even when Tesla introduced the Roadster in 2009 and early market signals began pointing toward electric vehicles, most manufacturers continued investing heavily in hydrogen. For many, the public acknowledgment of the wrong bet did not come until around 2020.
The same pattern holds for solid-state drives versus hard disk drives. For online versus offline payment. Across every domain where the data has been applied, the fastest improving technology ended up dominating. Without exception.
"The fastest improving technology always wins. We have never found an exception to this in any field."
That is not a theory. It is an empirical pattern, visible in advance, now detectable before the market catches up.
What This Means for Your Technology Strategy
If improvement rate is the predictor, and if improvement rate is measurable from patent citation data years before it becomes obvious in the market, then technology strategy does not have to be guesswork. You do not have to wait for industry consensus. You do not have to rely on which direction most competitors are moving. You can measure the rate, identify the trajectory, and make the bet with confidence.
That is what GetFocus delivers. Not opinions about which technologies seem promising. An objective, data-grounded signal about which ones are improving fast enough to matter, and when they will be ready to compete.


Ready to see it in action?
Discover how GetFocus can transform your strategic decision-making process today.
