Stay ahead of the curve
Get exclusive insights delivered directly to your inbox. Join thousands of tech leaders.
TL;DR
- Fourteen competing routes to low-carbon ethylene improve at rates differing by more than 3x — electrochemical CO₂ to CO at 43.6% a year against conventional steam cracking at 13.0%.
- Readiness level tells you where a technology is today; improvement rate tells you where it will be when your capital decision matures.
- The organisational consequence lands first: electrochemistry needs different people, a different bench, and a decision about crackers financed on a forty-year life.
- Ethylene is the worked example. The method is to find your contested domain and compare trajectories, not press releases.
Ethylene is the largest-volume organic chemical in the world, and almost all of it still comes from steam cracking — a process the industry has been refining for the better part of a century. Ask how it gets decarbonised and you will get fourteen different answers, each with its own pilot plant, its own consortium, and its own confident roadmap.
At Chemical Innovation Exchange in Indianapolis on 9 September 2026, GetFocus co-founder Jard van Ingen put those fourteen routes on a single chart — and the chart said something uncomfortable. The routes are not converging. They are improving at rates that differ by more than a factor of three. Over a fifteen-year investment horizon, that gap decides the winner long before any of the current pilots reach commercial scale.
Maturity tells you where a technology is. Rate tells you where it is going.
Most technology scouting answers one question: how mature is it? Technology Readiness Level is the standard instrument, and it is genuinely useful — it tells you whether something works in a lab, a pilot, or a plant. What it cannot tell you is how fast the gap between a lab and a plant is closing.
That second number is the Technology Improvement Rate: the annual rate at which a technology's performance is compounding, derived from the patent record rather than from a roadmap. A technology at TRL 4 improving at 40% a year and a technology at TRL 8 improving at 10% a year look nothing alike on a maturity chart. On a fifteen-year horizon they trade places.
The automotive industry ran this experiment in public. Hydrogen fuel cells and lithium-ion batteries were both plausible answers to the same question, and the industry put roughly $20 billion of cumulative investment into fuel cells over twenty-five years. Lithium-ion improved faster from the first data point onward. The maturity picture said hydrogen was ready; the rate said batteries would get there first. The rate was right.
The industry filed into hydrogen for twenty-five years. The rate said batteries from the first data point.
Fourteen routes, plotted on both axes at once
Plotting maturity against improvement rate turns a list of options into four decisions. Mature and fast-improving is where you fund. Immature but fast-improving is where you monitor closely, because it will not stay immature. Mature and slow is where you plan the phase-out. Immature and slow is where you stop spending attention.
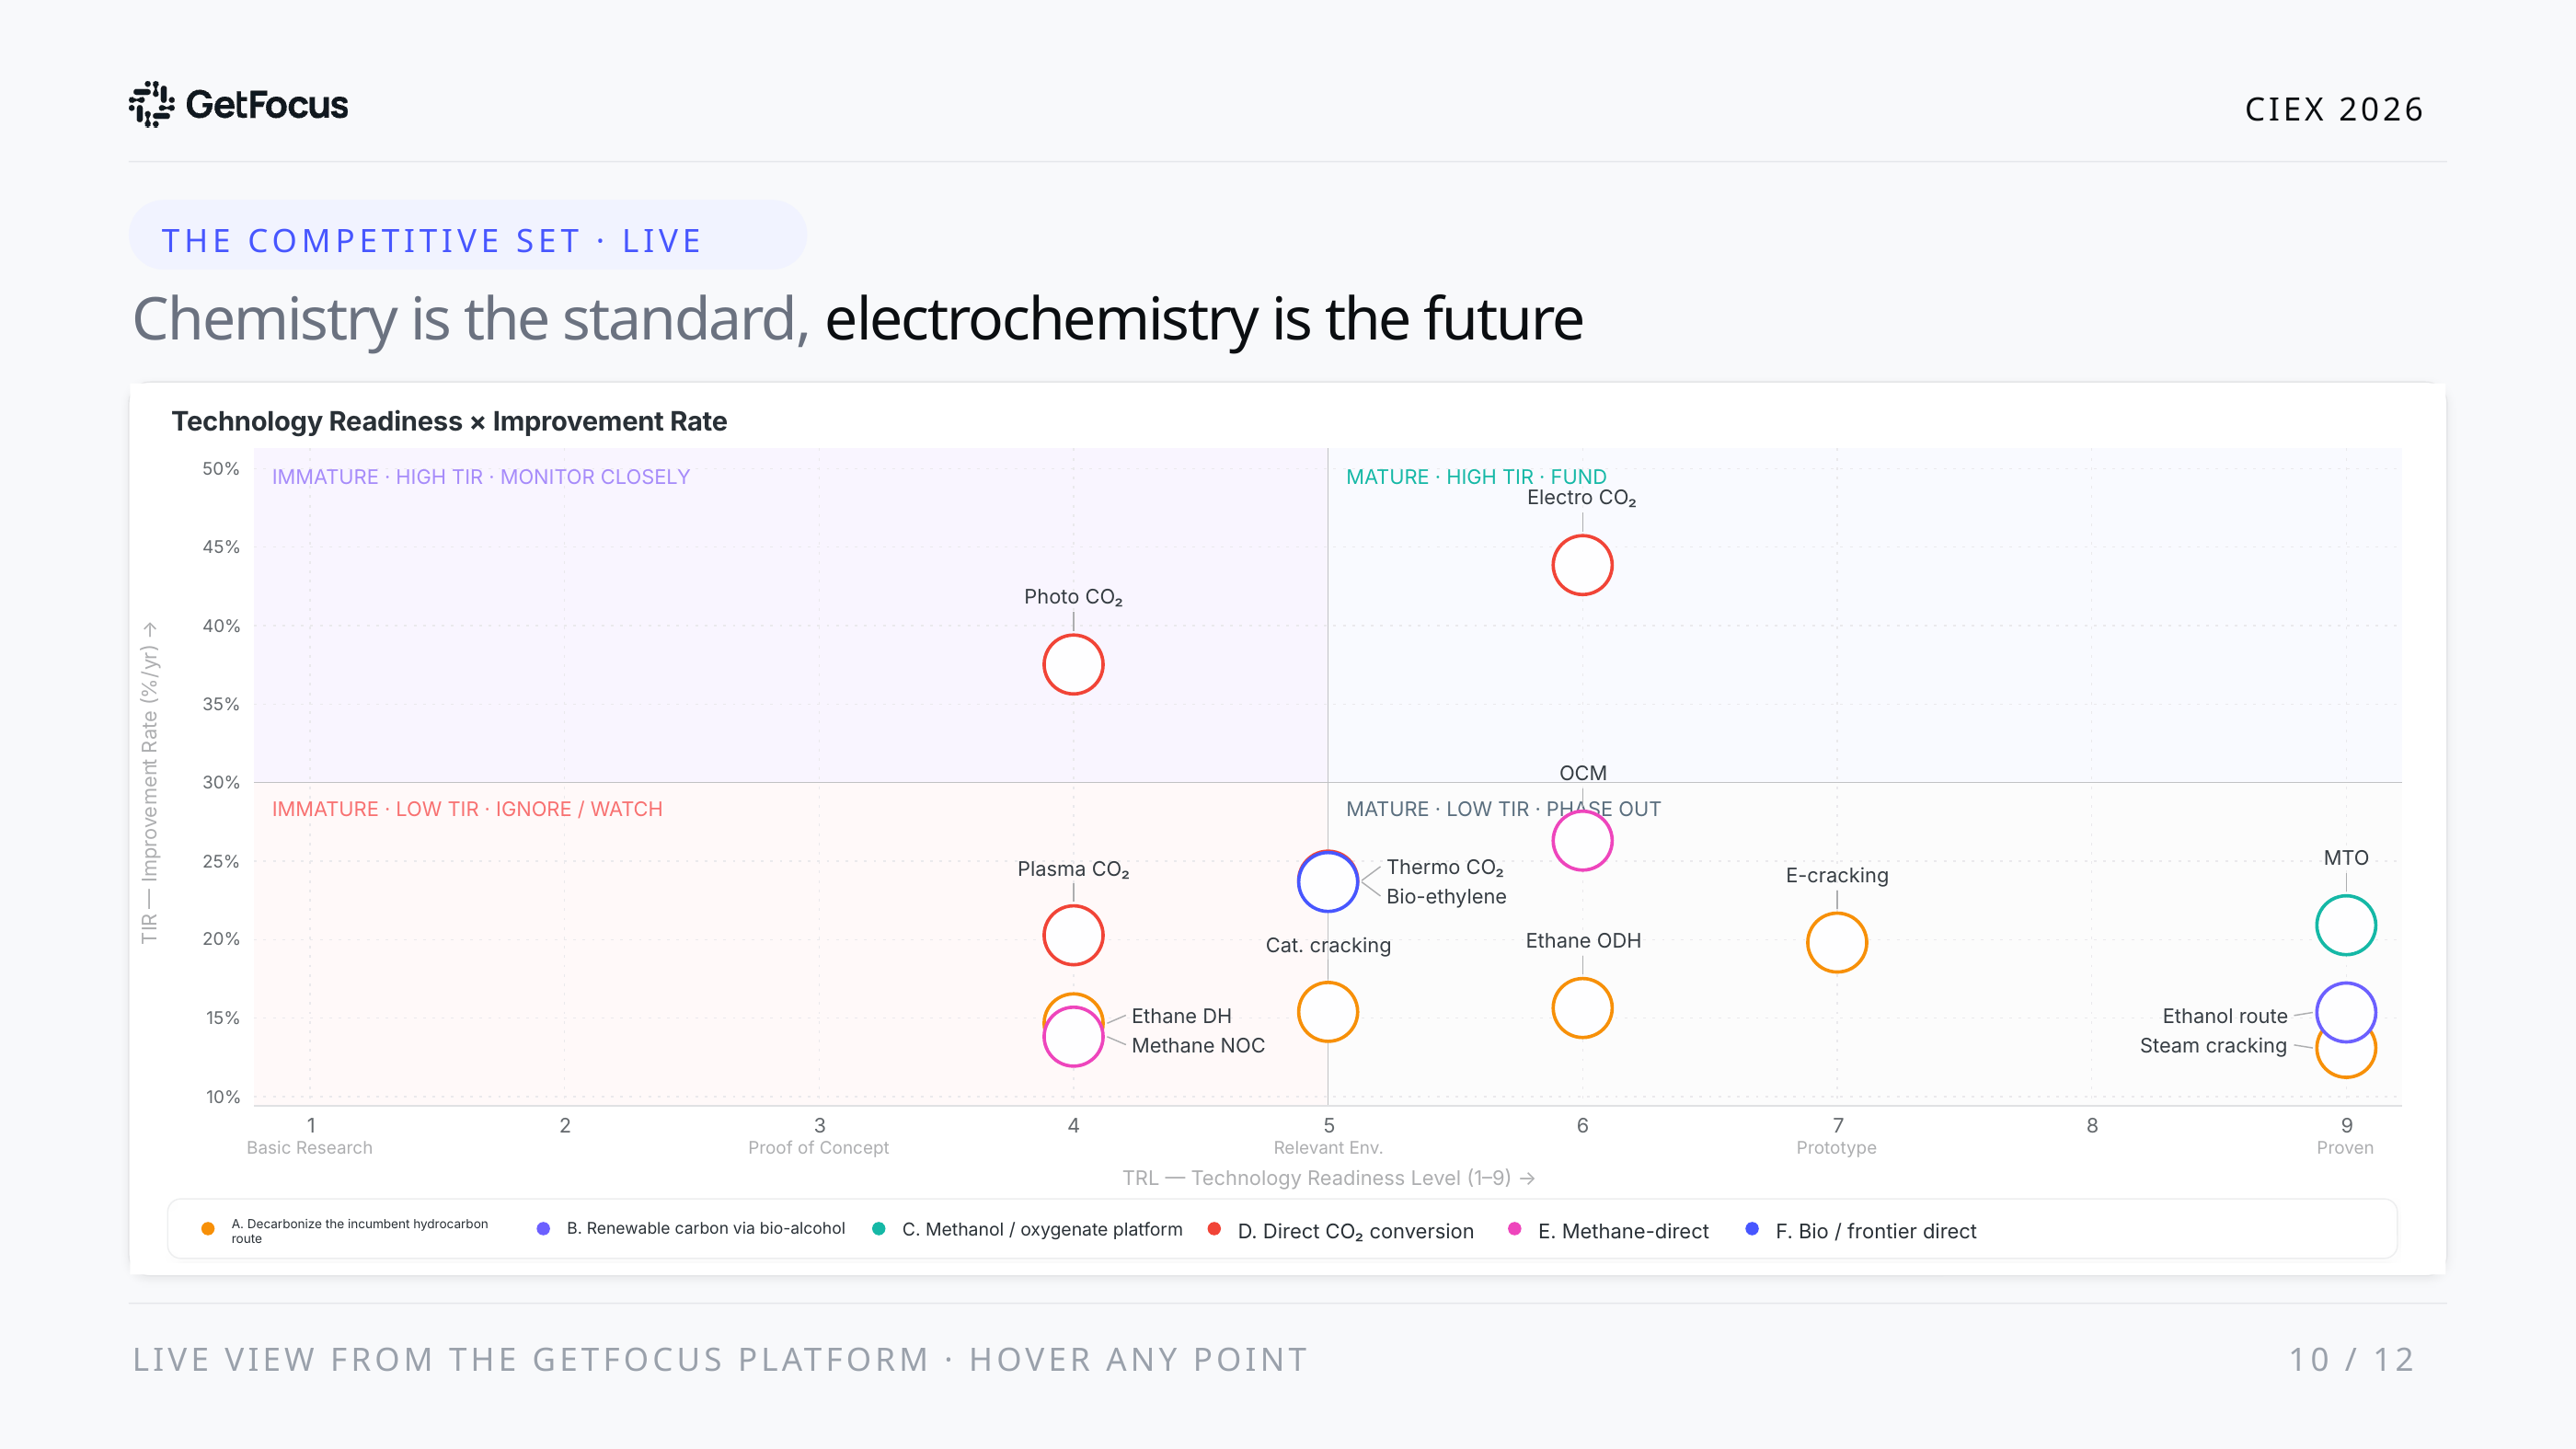
Conventional steam cracking sits exactly where you would expect: fully mature, improving slowly, and still responsible for almost all production. The electrochemical routes sit in the opposite corner — early, unproven at scale, and compounding at rates the incumbent process has not seen in decades.
The rates themselves
Here is the underlying data, ranked. Every figure is an annual improvement rate derived from patent activity in that specific route, not a forecast of market share.
The spread is the finding. Electrochemical CO₂ to CO is compounding at more than three times the rate of the process that makes essentially all of today's ethylene. Even the middle of the field — methanol-to-olefins, electrified cracking — is moving at roughly half again the incumbent's pace.
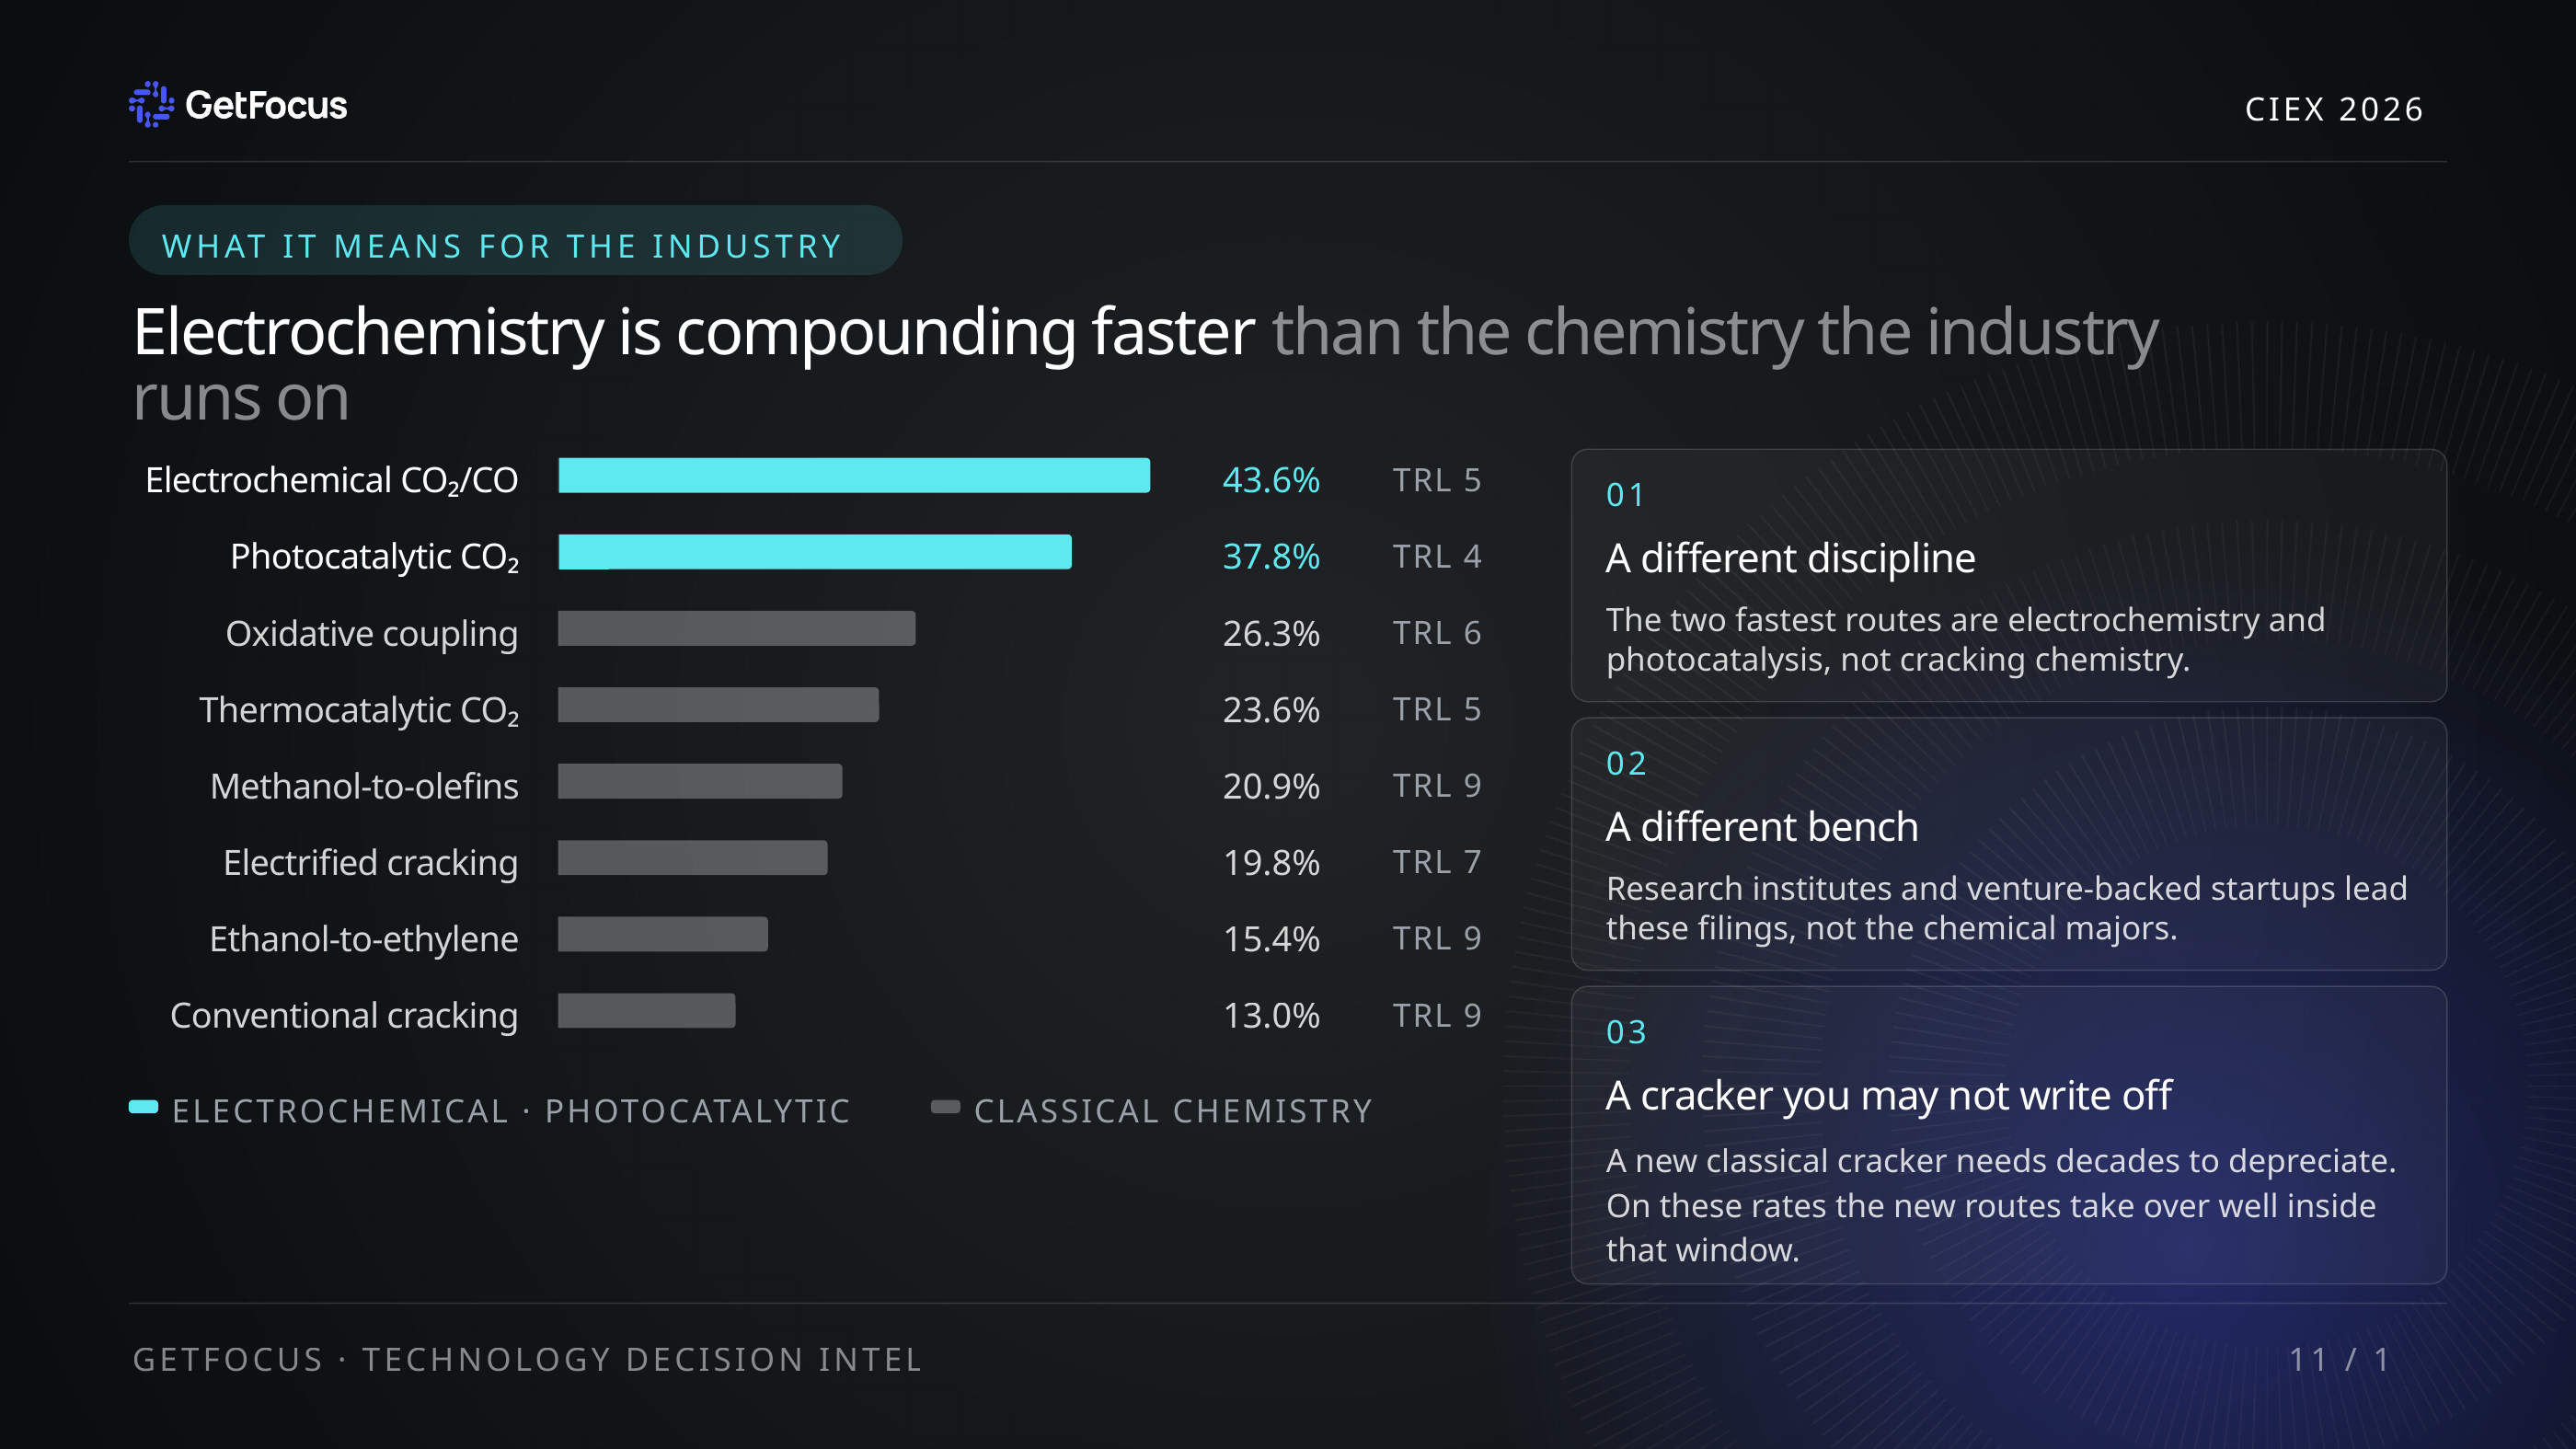
Do we even have the right people?
The three implications on that slide are not about chemistry. They are about the organisation that would have to run it.
Electrochemistry is a different discipline from thermal catalysis. It needs electrochemists, membrane and electrode specialists, and people who think in current density and faradaic efficiency rather than residence time and selectivity. It needs a different bench: electrolyser test rigs, not tubular reactors. And it eventually needs a decision about crackers that were financed on the assumption of a forty-year life.
Do we even have the right people?
That question is the one most R&D leaders in the room recognised, and it is the one improvement-rate data answers earliest. A hiring plan takes three to five years to change the shape of a research organisation. If the rate tells you which discipline matters in 2035, you need to act on it in 2026, not once the technology is obviously mature.
Ethylene is the worked example. The method is the point: find the domain where your position is genuinely contested, enumerate every route that could serve it, and compare their trajectories rather than their press releases.
The economics objection, and why it does not close the question
The standard response to any of this is that the fast-improving route is not competitive today. That is true, and it is not the end of the argument.
A steam cracker is financed on a multi-decade life. A decision taken today about whether to relifetime, revamp or retire one is a decision about the 2050s — and it is being taken against a process whose improvement rate is the slowest on the board.
The question is not whether electrochemical ethylene is cheaper this year. It is whether the capital you are about to commit outlives the point at which it stops being the cheapest option.
You're absolutely right, it's not competitive today. But it is improving very fast.
Turning it into a living decision system
None of this works as a one-off study. Improvement rates move as the patent record fills in, and a chart built eighteen months ago is a chart of eighteen months ago. The version that holds up is a standing process.
Ethylene is the example. The real question is your contested domain.
Every R&D portfolio has one: the domain where the incumbent process is mature, the alternatives are early, and the decision about which to back is being made on maturity and conference buzz because nobody has put the trajectories side by side.
Fourteen routes to ethylene, improving at rates that differ by a factor of three, is what that looks like when you do put them side by side. The uncomfortable part is not that the answer is surprising. It is that the data to see it was available years before anyone acted on it.
Notes and sources
What is a Technology Improvement Rate?
It is the annual rate at which a technology's performance is compounding, estimated from the patent record rather than from vendor roadmaps or analyst forecasts. It answers how fast a technology is getting better, which is a different question from how mature it is today.
Why not just use Technology Readiness Level?
TRL describes present maturity and nothing else. Two technologies at the same TRL can be moving at completely different speeds, and on a ten- to fifteen-year capital horizon that difference decides which one you should be building capability around.
Do these rates predict cost or market share?
No. They describe the pace of technical progress in each route. Cost parity and adoption depend on feedstock prices, electricity prices, policy and capital availability, none of which are inputs to the rate.
What about the readiness level of the electrochemical route?
The CIEX presentation and the spoken talk differ on this point: slide 11 assigns electrochemical CO₂ to CO a TRL of 5, while slide 10 and the talk place it at TRL 6. Because the discrepancy is unresolved in the source material, no single readiness value is stated for that route in this article.
Where does this article come from?
It is based on Jard van Ingen's talk at Chemical Innovation Exchange, Indianapolis, 9 September 2026, and the accompanying GetFocus presentation. All figures are taken from that material; no external claims have been added.